- Home >
- Stock Photos >
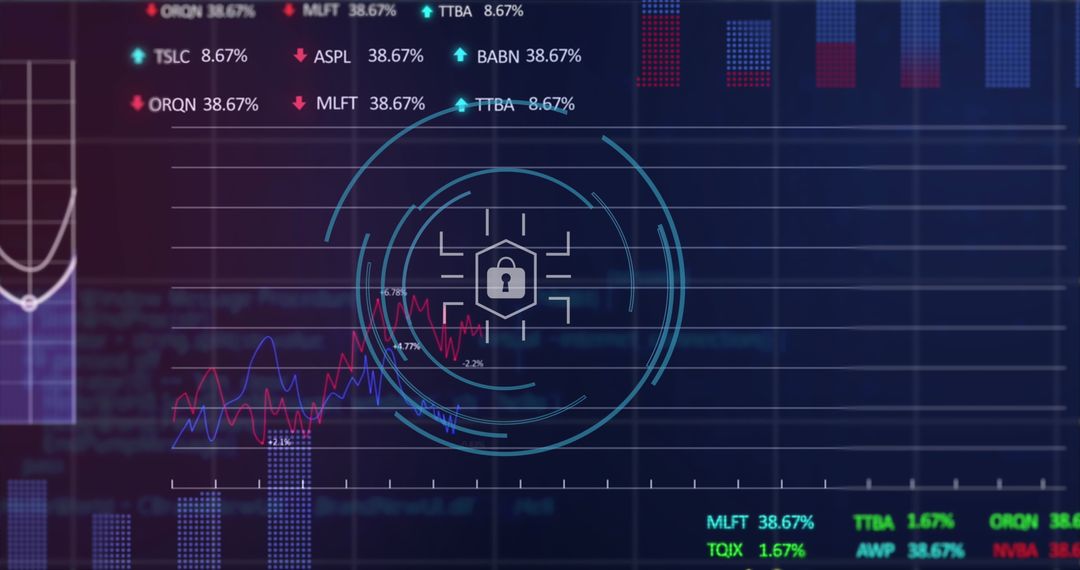
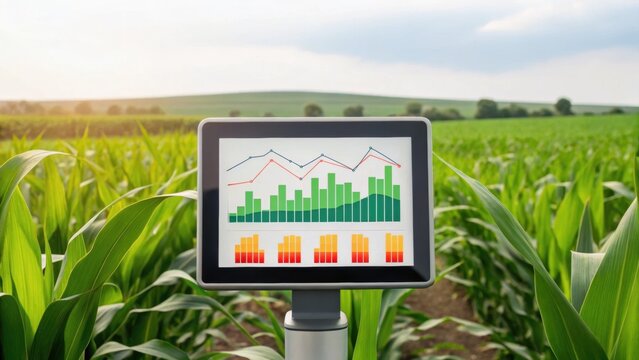
- Sustainable Energy Dashboard with Analytics Interface
Sustainable Energy Dashboard with Analytics Interface Image

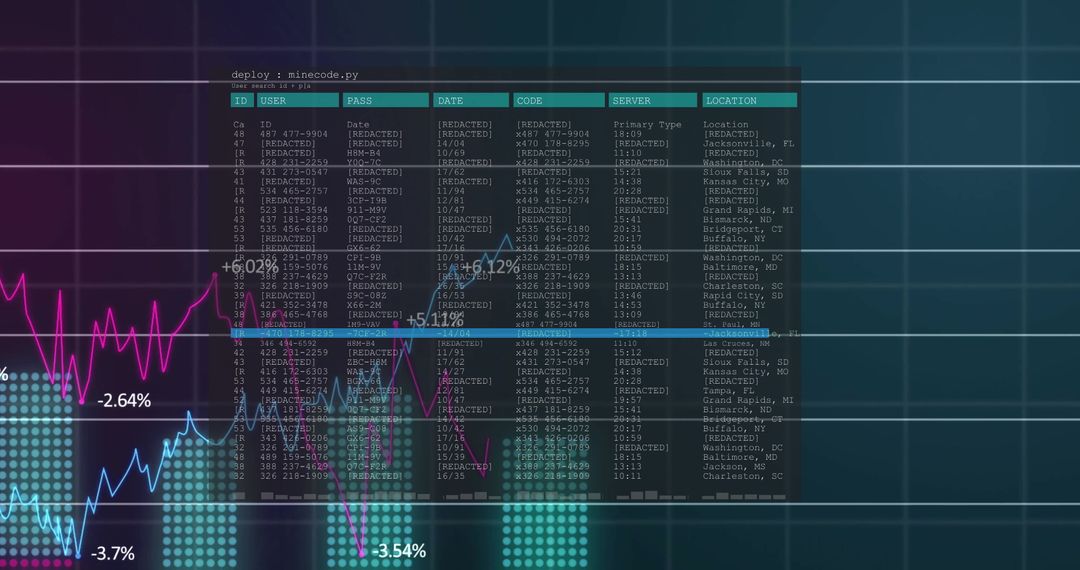
Visual representation of a high-tech dashboard focused on sustainable energy sources and analytics. Ideal for illustrating articles or presentations about renewable energy advancements, carbon emission tracking, or technology's role in sustainability. Useful for environmental tech apps, educational content on green technology, or company reports highlighting innovation and sustainability efforts.
Powered by 


0
downloads
downloads
Tags:
More
Credit Photo
If you would like to credit the Photo, here are some ways you can do so
Text Link
photo Link
<span class="text-link">
<span>
<a target="_blank" href=https://pikwizard.com/photo/sustainable-energy-dashboard-with-analytics-interface/639103589ec1e99bc0d0b30dd8385d8e/>PikWizard</a>
</span>
</span>
<span class="image-link">
<span
style="margin: 0 0 20px 0; display: inline-block; vertical-align: middle; width: 100%;"
>
<a
target="_blank"
href="https://pikwizard.com/photo/sustainable-energy-dashboard-with-analytics-interface/639103589ec1e99bc0d0b30dd8385d8e/"
style="text-decoration: none; font-size: 10px; margin: 0;"
>
<img src="https://pikwizard.com/pw/medium/639103589ec1e99bc0d0b30dd8385d8e.jpg" style="margin: 0; width: 100%;" alt="" />
<p style="font-size: 12px; margin: 0;">PikWizard</p>
</a>
</span>
</span>
Free (free of charge)
Free for personal and commercial use.
Author: Creative Art
Similar Free Stock Images

Premium


Premium


Premium


Premium


Premium


Premium


Premium


Premium


Premium


Premium


Premium


Premium


Premium


Premium


Premium


Premium


Premium


Premium


Premium


Premium


Premium


Premium


Premium


Premium