
- Home >
- Stock Photos >
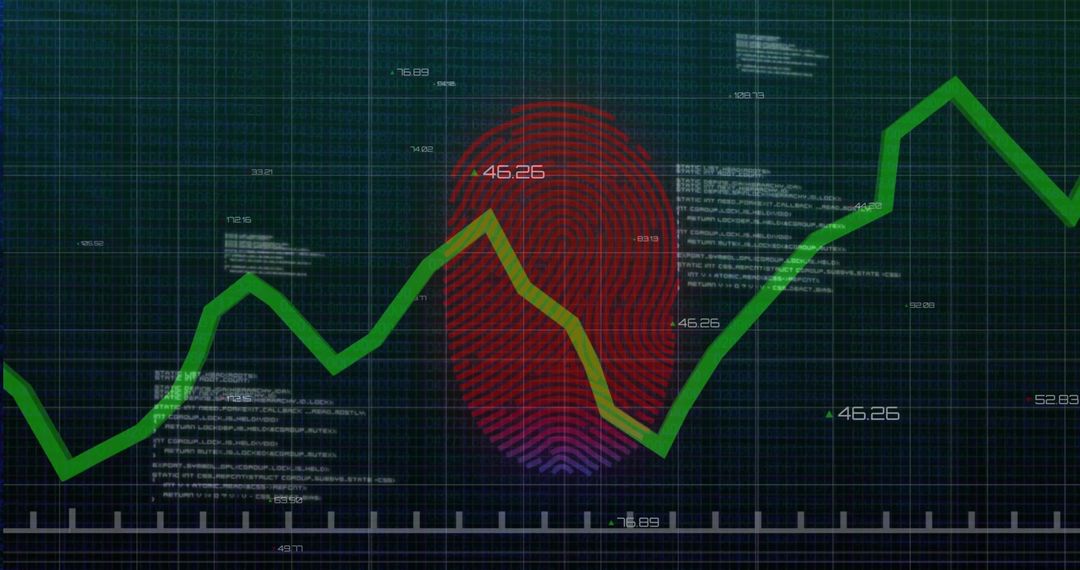
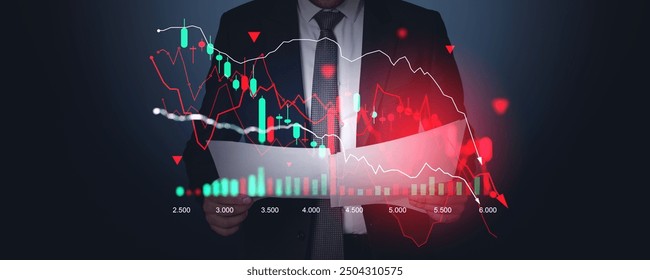
- Thick red trend line declining across dashboard grid with green markers and labels
Thick red trend line declining across dashboard grid with green markers and labels Image

Showing thick red trend line moving downward across dark dashboard grid with green triangular markers and numeric labels indicating key data points. Featuring high contrast color palette highlighting market decline and volatility. Suiting finance presentations, investor reports, market analysis articles, fintech website banners, trading blog posts, and social media alerts. Working well as background for slide decks, data dashboards, press releases, and news graphics. Editable overlay space allowing addition of headlines, logos, or annotations. Supplying clean modern visual for communicating risk, loss, performance tracking, or market trend stories.
Powered by  - Get 15% off with code: PIKWIZARD15


0
downloads
downloads
Tags:
More
Credit Photo
If you would like to credit the Photo, here are some ways you can do so
Text Link
photo Link
<span class="text-link">
<span>
<a target="_blank" href=https://pikwizard.com/photo/thick-red-trend-line-declining-across-dashboard-grid-with-green-markers-and-labels/7470d854d1e472bfe703b6099e74e119/>PikWizard</a>
</span>
</span>
<span class="image-link">
<span
style="margin: 0 0 20px 0; display: inline-block; vertical-align: middle; width: 100%;"
>
<a
target="_blank"
href="https://pikwizard.com/photo/thick-red-trend-line-declining-across-dashboard-grid-with-green-markers-and-labels/7470d854d1e472bfe703b6099e74e119/"
style="text-decoration: none; font-size: 10px; margin: 0;"
>
<img src="https://pikwizard.com/pw/medium/7470d854d1e472bfe703b6099e74e119.jpg" style="margin: 0; width: 100%;" alt="" />
<p style="font-size: 12px; margin: 0;">PikWizard</p>
</a>
</span>
</span>
Free (free of charge)
Free for personal and commercial use.
Author: People Creations
Similar Free Stock Images

Premium


Premium


Premium


Premium


Premium


Premium


Premium


Premium


Premium


Premium


Premium


Premium


Premium


Premium


Premium


Premium


Premium


Premium


Premium


Premium


Premium


Premium


Premium


Premium

