
- Home >
- Stock Photos >
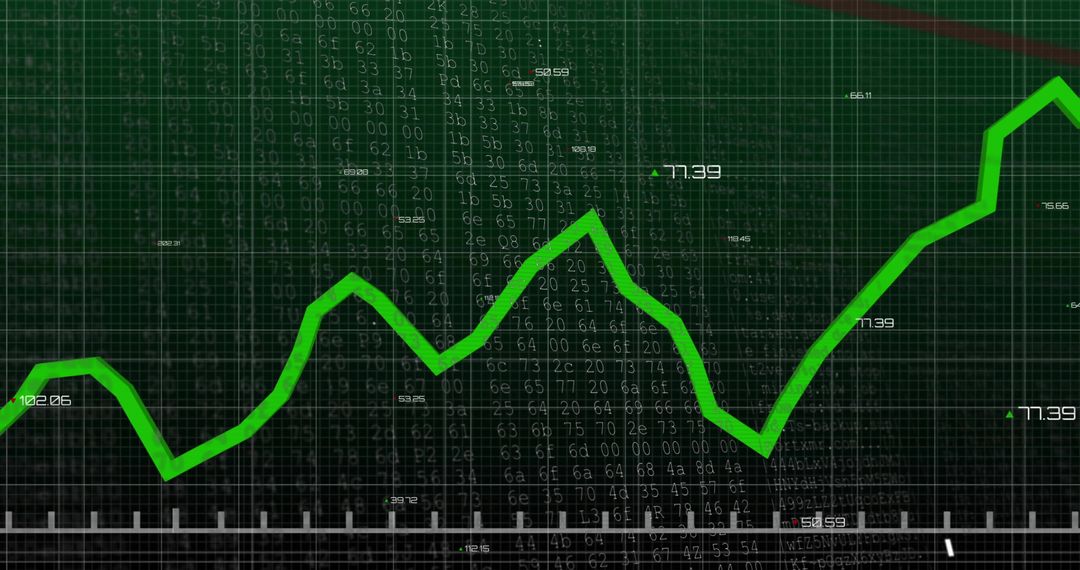
- Tracking rising market trend with bold green line on futuristic trading dashboard display
Tracking rising market trend with bold green line on futuristic trading dashboard display Image
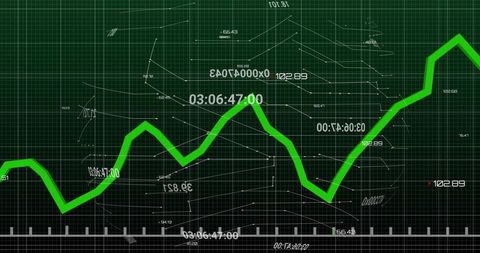
Bold neon green line graph rising across dark green grid, showing fluctuating stock values, ticks, and timecode overlays. Background featuring technical grid lines, numerical annotations, scale markers, and subtle wireframe graphics for futuristic data feel. High contrast color palette providing clear focal point for headlines. Ideal for financial reports, investor presentations, market analysis articles, website hero banners, trading platform interfaces, app dashboards, social media campaigns, and business blog headers. Easily overlaying text, logos, or charts for customization. Delivering professional, modern look for finance, technology, investment, and analytics projects.
Powered by  - Get 15% off with code: PIKWIZARD15


0
downloads
downloads
Tags:
More
Credit Photo
If you would like to credit the Photo, here are some ways you can do so
Text Link
photo Link
<span class="text-link">
<span>
<a target="_blank" href=https://pikwizard.com/photo/tracking-rising-market-trend-with-bold-green-line-on-futuristic-trading-dashboard-display/2acd1a17d2aba7daf8b94d240d4e8bfc/>PikWizard</a>
</span>
</span>
<span class="image-link">
<span
style="margin: 0 0 20px 0; display: inline-block; vertical-align: middle; width: 100%;"
>
<a
target="_blank"
href="https://pikwizard.com/photo/tracking-rising-market-trend-with-bold-green-line-on-futuristic-trading-dashboard-display/2acd1a17d2aba7daf8b94d240d4e8bfc/"
style="text-decoration: none; font-size: 10px; margin: 0;"
>
<img src="https://pikwizard.com/pw/medium/2acd1a17d2aba7daf8b94d240d4e8bfc.jpg" style="margin: 0; width: 100%;" alt="" />
<p style="font-size: 12px; margin: 0;">PikWizard</p>
</a>
</span>
</span>
Free (free of charge)
Free for personal and commercial use.
Author: People Creations
Similar Free Stock Images

Premium


Premium


Premium


Premium


Premium


Premium


Premium


Premium


Premium


Premium


Premium


Premium


Premium


Premium


Premium


Premium


Premium


Premium


Premium


Premium


Premium


Premium


Premium


Premium

