- Home >
- Stock Photos >
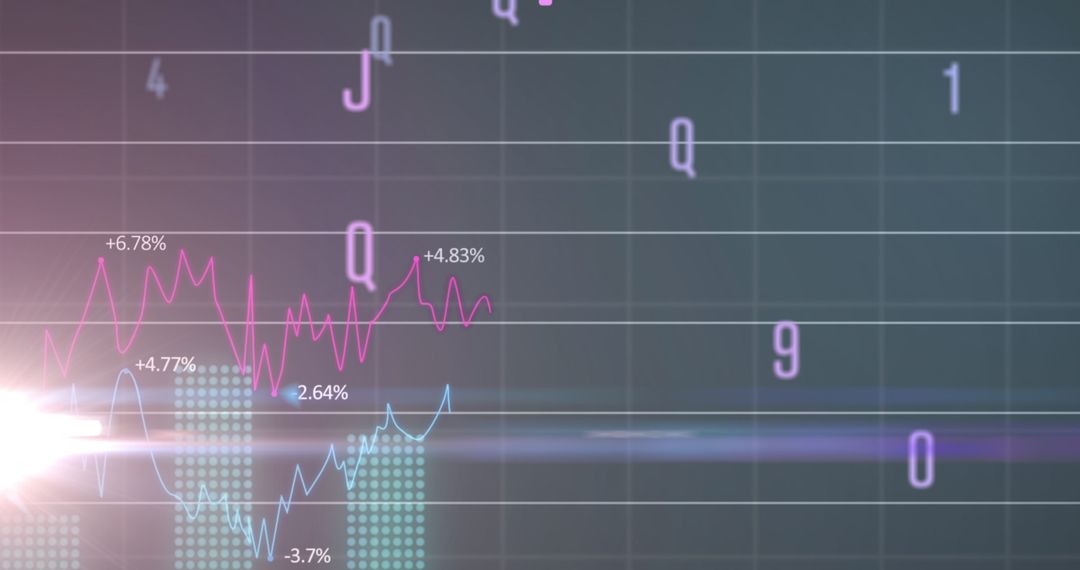
- Transforming Data and Financial Analysis on Pink Graph
Transforming Data and Financial Analysis on Pink Graph Image

Illustrates financial data visualization, suitable for resources on global market trends, investment strategies, or financial analytics education. Ideal for background on finance or data-driven publications.
Powered by 


2
downloads
downloads
Tags:
More
Credit Photo
If you would like to credit the Photo, here are some ways you can do so
Text Link
photo Link
<span class="text-link">
<span>
<a target="_blank" href=https://pikwizard.com/photo/transforming-data-and-financial-analysis-on-pink-graph/c0d1b43e4d6968701b7b2bdc014cc88c/>PikWizard</a>
</span>
</span>
<span class="image-link">
<span
style="margin: 0 0 20px 0; display: inline-block; vertical-align: middle; width: 100%;"
>
<a
target="_blank"
href="https://pikwizard.com/photo/transforming-data-and-financial-analysis-on-pink-graph/c0d1b43e4d6968701b7b2bdc014cc88c/"
style="text-decoration: none; font-size: 10px; margin: 0;"
>
<img src="https://pikwizard.com/pw/medium/c0d1b43e4d6968701b7b2bdc014cc88c.jpg" style="margin: 0; width: 100%;" alt="" />
<p style="font-size: 12px; margin: 0;">PikWizard</p>
</a>
</span>
</span>
Free (free of charge)
Free for personal and commercial use.
Author: People Creations
Similar Free Stock Images

Premium


Premium


Premium


Premium


Premium


Premium


Premium


Premium


Premium


Premium


Premium


Premium


Premium


Premium


Premium


Premium


Premium


Premium


Premium


Premium


Premium


Premium


Premium


Premium