- Home >
- Stock Photos >
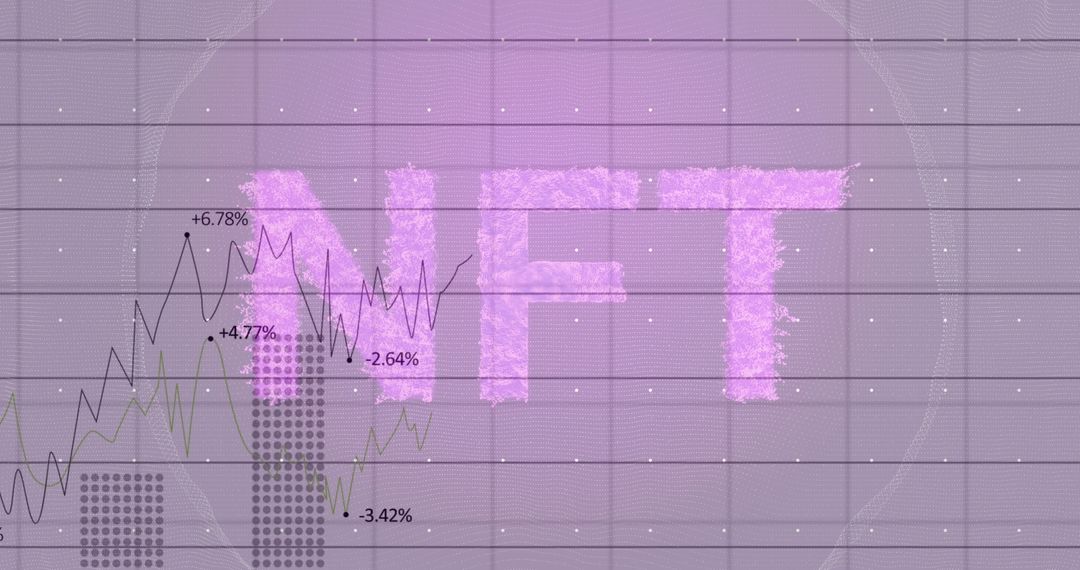
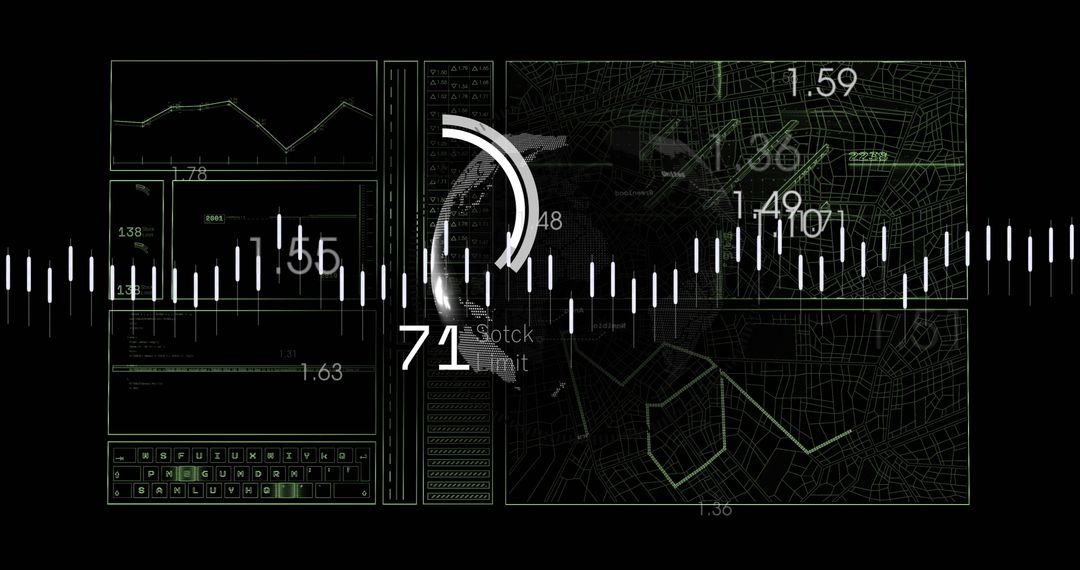
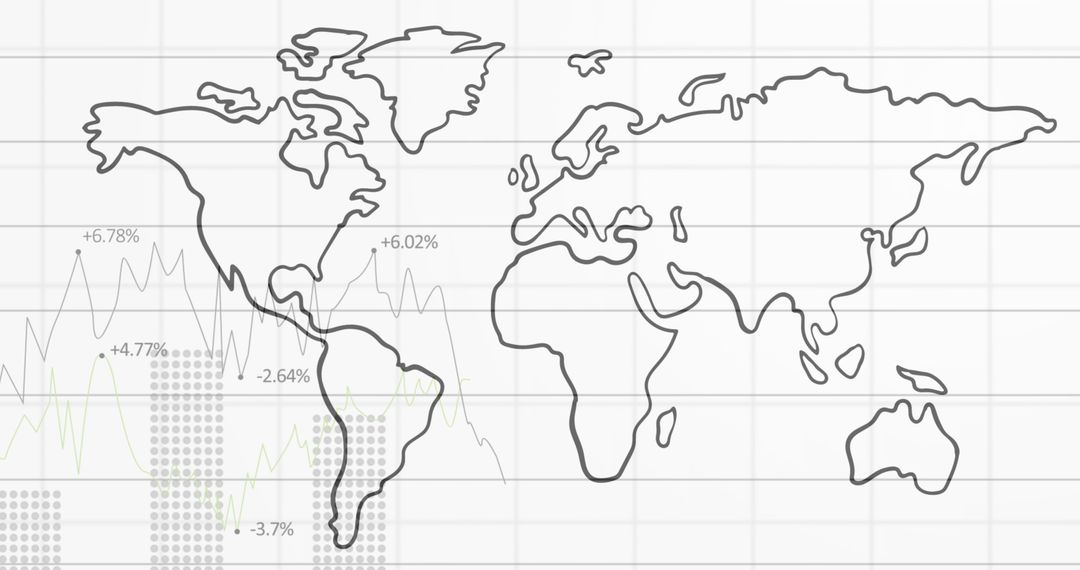
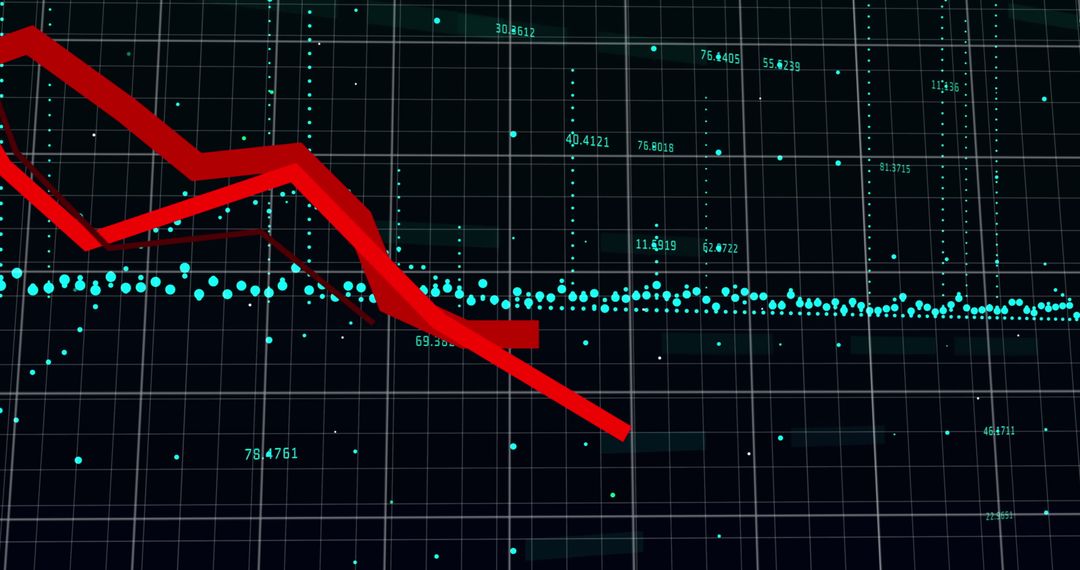
- Uncertainty in Financial Data Analysis with Question Mark Overlay
Uncertainty in Financial Data Analysis with Question Mark Overlay Image
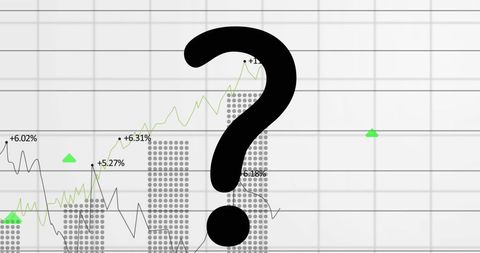
Conceptual visual represents uncertainty in financial data analysis. Useful in digital business reports, finance-related articles, and educational materials focusing on market speculation and analysis challenges.
Powered by 


0
downloads
downloads
Tags:
More
Credit Photo
If you would like to credit the Photo, here are some ways you can do so
Text Link
photo Link
<span class="text-link">
<span>
<a target="_blank" href=https://pikwizard.com/photo/uncertainty-in-financial-data-analysis-with-question-mark-overlay/284ecb394cb6af0bf6e079651a727c20/>PikWizard</a>
</span>
</span>
<span class="image-link">
<span
style="margin: 0 0 20px 0; display: inline-block; vertical-align: middle; width: 100%;"
>
<a
target="_blank"
href="https://pikwizard.com/photo/uncertainty-in-financial-data-analysis-with-question-mark-overlay/284ecb394cb6af0bf6e079651a727c20/"
style="text-decoration: none; font-size: 10px; margin: 0;"
>
<img src="https://pikwizard.com/pw/medium/284ecb394cb6af0bf6e079651a727c20.jpg" style="margin: 0; width: 100%;" alt="" />
<p style="font-size: 12px; margin: 0;">PikWizard</p>
</a>
</span>
</span>
Free (free of charge)
Free for personal and commercial use.
Author: Authentic Images
Similar Free Stock Images
Premium


Premium


Premium


Premium


Premium


Premium


Premium


Premium


Premium


Premium


Premium


Premium


Premium


Premium


Premium


Premium


Premium


Premium


Premium


Premium


Premium


Premium


Premium


Premium