
- Home >
- Stock Photos >
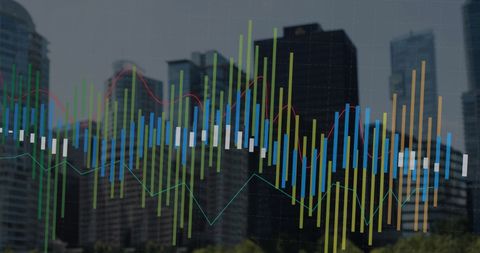
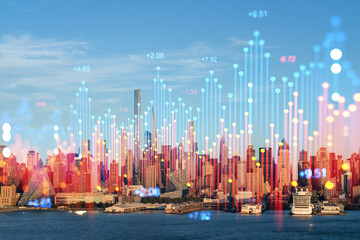
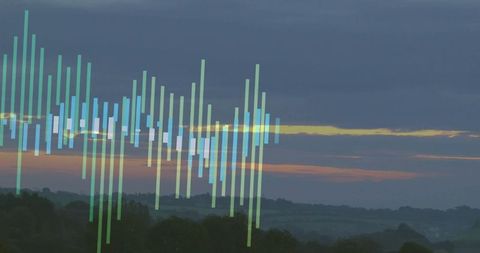
- Urban Finance Data Visualization with Candlestick Chart Overlay
Urban Finance Data Visualization with Candlestick Chart Overlay Image
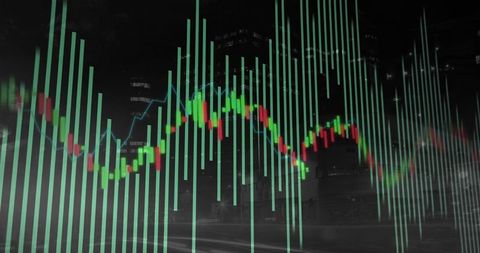
Depicts a blend of urban elements and financial data visualization featuring green and red candlestick charts and vertical green lines, overlaid against a city street at night. The blue line suggests trends amidst a busy metropolis atmosphere. Useful for illustrating themes of finance, technology, and analytics in corporate presentations, educational material on financial markets, or visually captivating publication images.
Powered by 


downloads
Tags:
More
Credit Photo
If you would like to credit the Photo, here are some ways you can do so
Text Link
photo Link
<span class="text-link">
<span>
<a target="_blank" href=https://pikwizard.com/photo/urban-finance-data-visualization-with-candlestick-chart-overlay/c17eb5e696d7f3e7cfa1efd23b3686bc/>PikWizard</a>
</span>
</span>
<span class="image-link">
<span
style="margin: 0 0 20px 0; display: inline-block; vertical-align: middle; width: 100%;"
>
<a
target="_blank"
href="https://pikwizard.com/photo/urban-finance-data-visualization-with-candlestick-chart-overlay/c17eb5e696d7f3e7cfa1efd23b3686bc/"
style="text-decoration: none; font-size: 10px; margin: 0;"
>
<img src="https://pikwizard.com/pw/medium/c17eb5e696d7f3e7cfa1efd23b3686bc.jpg" style="margin: 0; width: 100%;" alt="" />
<p style="font-size: 12px; margin: 0;">PikWizard</p>
</a>
</span>
</span>
Free (free of charge)
Free for personal and commercial use.
Author: Authentic Images
Similar Free Stock Images
Premium


Premium


Premium


Premium


Premium


Premium


Premium


Premium


Premium

Premium

Premium


Premium


Premium


Premium


Premium

Premium


Premium


Premium


Premium


Premium


Premium


Premium


Premium


Premium


Premium


Explore More Free Stock Images