- Home >
- Stock Photos >
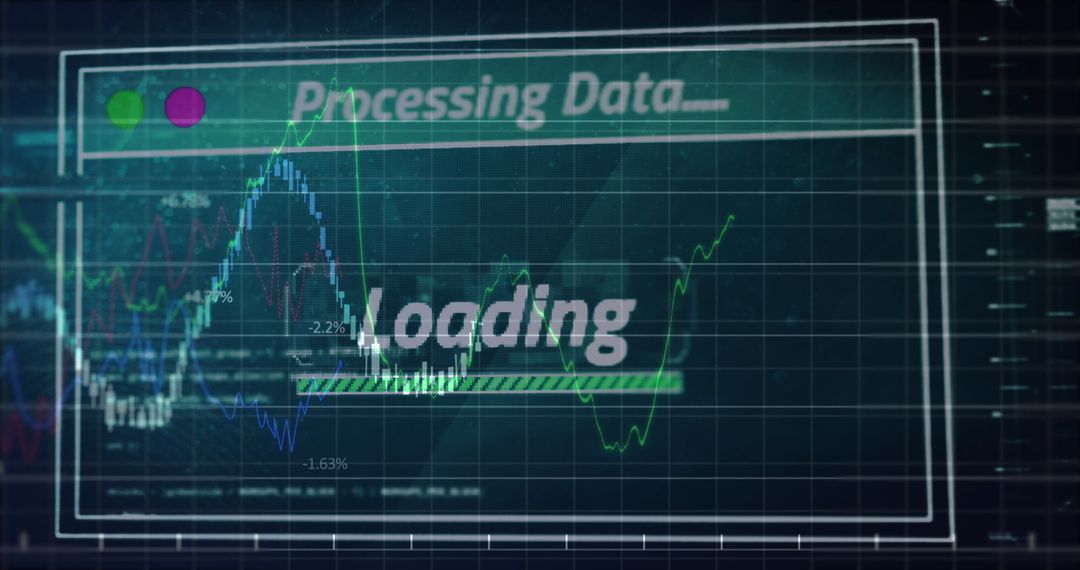
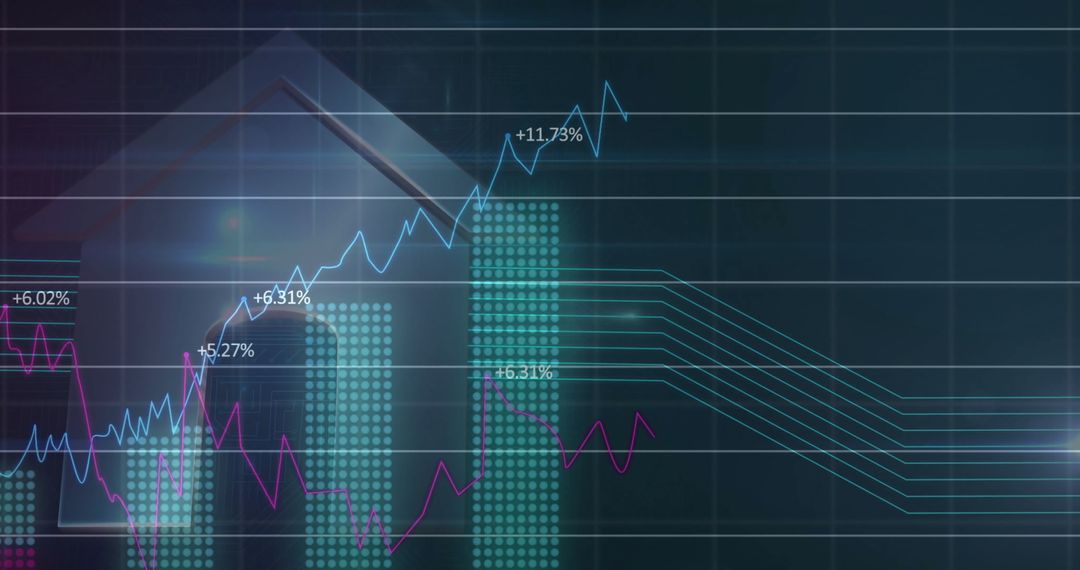
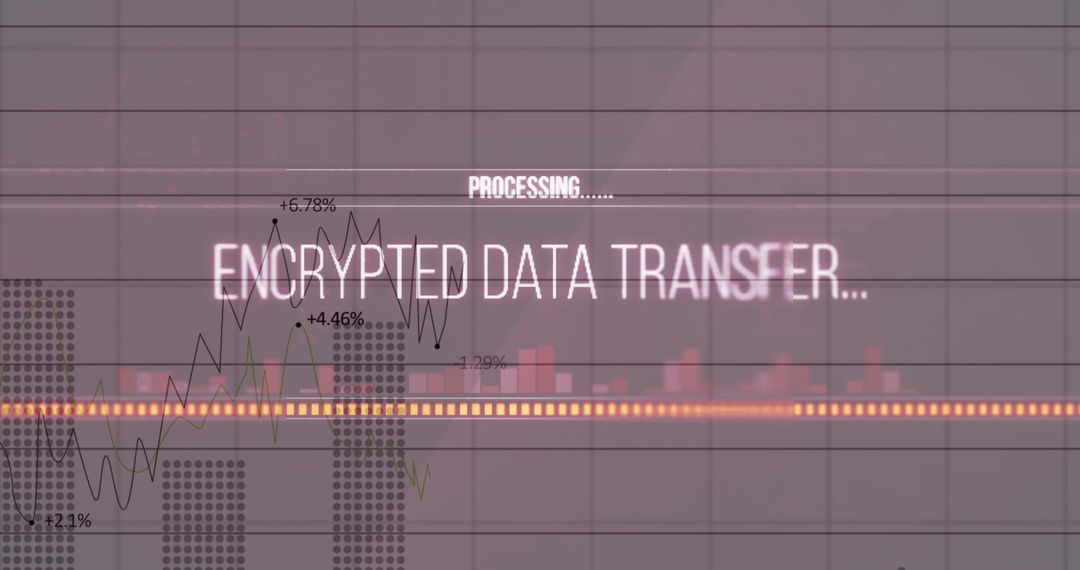
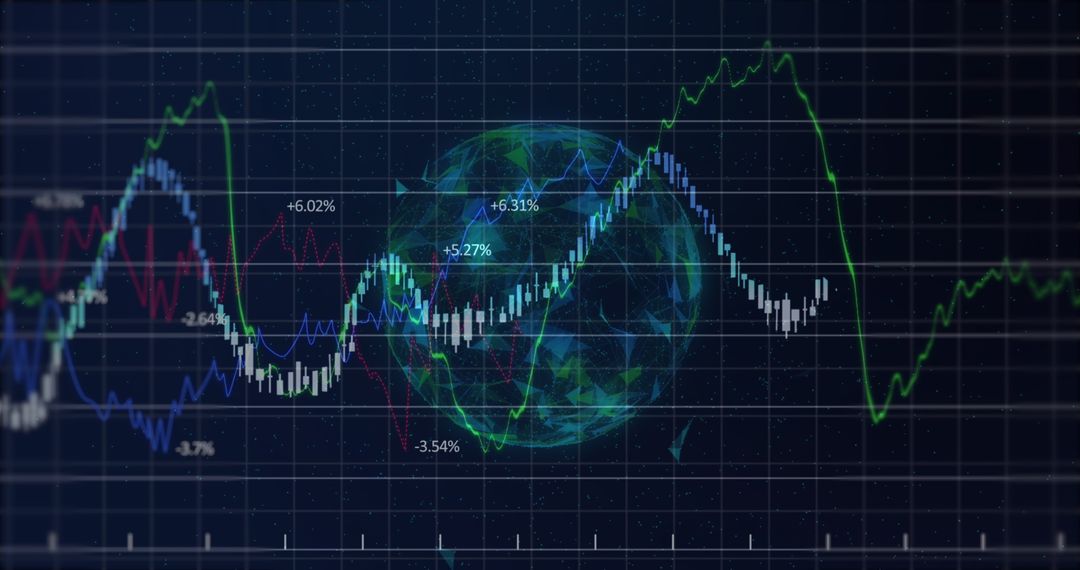
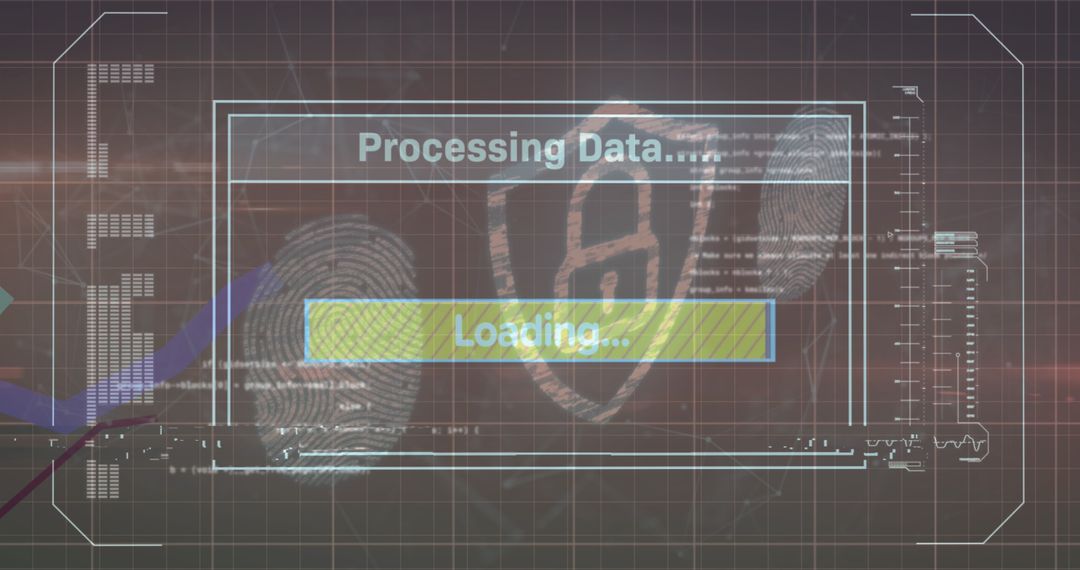
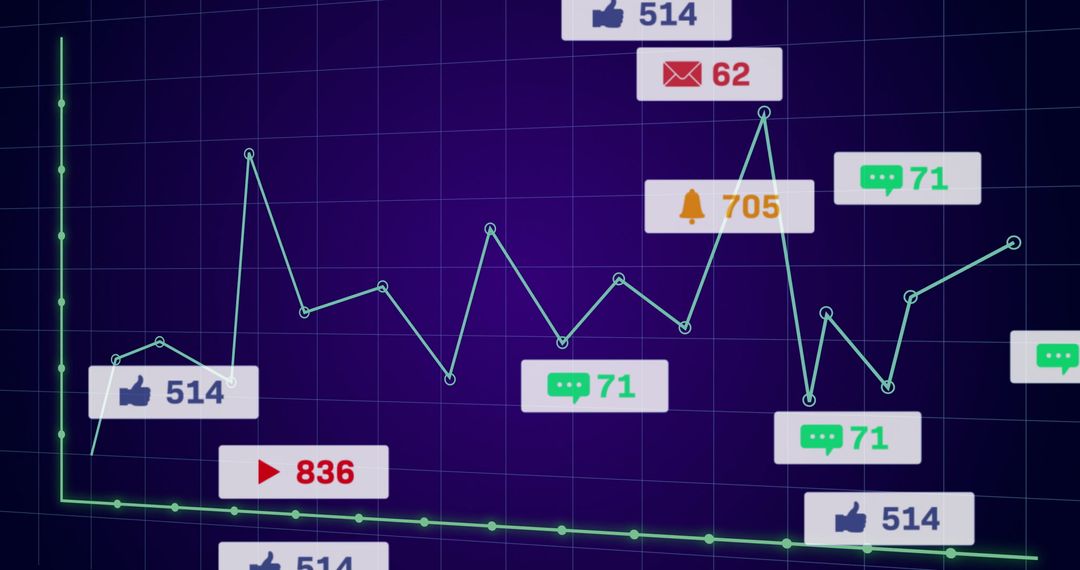
- Urgent Data Analysis Warning on Futuristic Graph Screen
Urgent Data Analysis Warning on Futuristic Graph Screen Image
Graph shows rising data trend on grid with 'Danger Immediate Action Required' in bold, suggesting urgent attention. Perfect for illustrating technologically advanced data analysis, risk management, cybersecurity, or economic forecasting scenarios.
Powered by 


0
downloads
downloads
Tags:
More
Credit Photo
If you would like to credit the Photo, here are some ways you can do so
Text Link
photo Link
<span class="text-link">
<span>
<a target="_blank" href=https://pikwizard.com/photo/urgent-data-analysis-warning-on-futuristic-graph-screen/3a4434e7436474f2e7dacbb787efd535/>PikWizard</a>
</span>
</span>
<span class="image-link">
<span
style="margin: 0 0 20px 0; display: inline-block; vertical-align: middle; width: 100%;"
>
<a
target="_blank"
href="https://pikwizard.com/photo/urgent-data-analysis-warning-on-futuristic-graph-screen/3a4434e7436474f2e7dacbb787efd535/"
style="text-decoration: none; font-size: 10px; margin: 0;"
>
<img src="https://pikwizard.com/pw/medium/3a4434e7436474f2e7dacbb787efd535.jpg" style="margin: 0; width: 100%;" alt="" />
<p style="font-size: 12px; margin: 0;">PikWizard</p>
</a>
</span>
</span>
Free (free of charge)
Free for personal and commercial use.
Author: Awesome Content
Similar Free Stock Images

Premium