
- Home >
- Stock Photos >
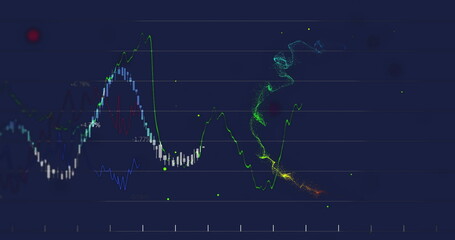
- Visualizing Dark Data Waveform Dashboard with Neon Time-Series Analytics and Grid
Visualizing Dark Data Waveform Dashboard with Neon Time-Series Analytics and Grid Image

Showing dark navy background with bright neon waveform and dotted secondary trace, vertical column markers and floating numeric labels. Delivering futuristic HUD-style visualization suitable for tech brands, finance reports, data science presentations, audio signal analysis, and UI mockups. Providing high-contrast visual focus for hero banners, slide decks, website headers, and app dashboards. Allowing overlay of text, logos, charts without visual clutter and maintaining clear safe area for headline and CTA placement. Working well for marketing campaigns, social media posts, editorial pieces, investor decks, and training materials. Including suggestions for color variations, cropping for mobile and desktop, and using as background for animated intros or interactive dashboards.
Powered by 


downloads
Tags:
More
Credit Photo
If you would like to credit the Photo, here are some ways you can do so
Text Link
photo Link
<span class="text-link">
<span>
<a target="_blank" href=https://pikwizard.com/photo/visualizing-dark-data-waveform-dashboard-with-neon-time-series-analytics-and-grid/ed7d7072aaf8376dcacd3725dcf5acfa/>PikWizard</a>
</span>
</span>
<span class="image-link">
<span
style="margin: 0 0 20px 0; display: inline-block; vertical-align: middle; width: 100%;"
>
<a
target="_blank"
href="https://pikwizard.com/photo/visualizing-dark-data-waveform-dashboard-with-neon-time-series-analytics-and-grid/ed7d7072aaf8376dcacd3725dcf5acfa/"
style="text-decoration: none; font-size: 10px; margin: 0;"
>
<img src="https://pikwizard.com/pw/medium/ed7d7072aaf8376dcacd3725dcf5acfa.jpg" style="margin: 0; width: 100%;" alt="" />
<p style="font-size: 12px; margin: 0;">PikWizard</p>
</a>
</span>
</span>
Free (free of charge)
Free for personal and commercial use.
Author: Awesome Content
Similar Free Stock Images

Premium


Premium

Premium


Premium


Premium

Premium


Premium


Premium


Premium


Premium


Premium


Explore More Free Stock Images