- Home >
- Stock Photos >
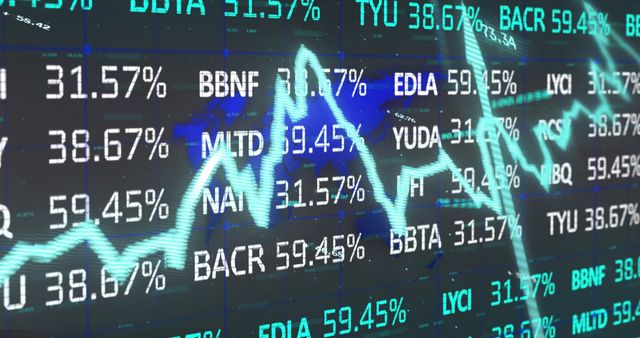
- Visualizing Financial Trends with Company Data and Graph
Visualizing Financial Trends with Company Data and Graph Image
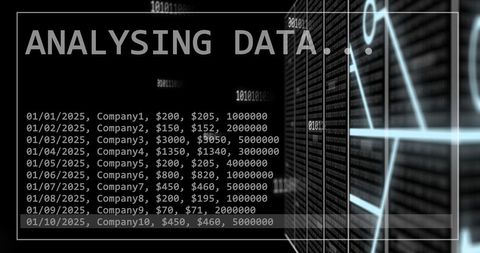
This dynamic illustration visualizes financial data analysis with trends, showcasing company figures and a rising graph. Ideal for use in financial reports, business strategy presentations, and educational materials on market analysis.

downloads
Tags:
More
Credit Photo
If you would like to credit the Photo, here are some ways you can do so
Text Link
photo Link
<span class="text-link">
<span>
<a target="_blank" href=https://pikwizard.com/photo/visualizing-financial-trends-with-company-data-and-graph/bcccf30bee45a8e215ff370717e4d68e/>PikWizard</a>
</span>
</span>
<span class="image-link">
<span
style="margin: 0 0 20px 0; display: inline-block; vertical-align: middle; width: 100%;"
>
<a
target="_blank"
href="https://pikwizard.com/photo/visualizing-financial-trends-with-company-data-and-graph/bcccf30bee45a8e215ff370717e4d68e/"
style="text-decoration: none; font-size: 10px; margin: 0;"
>
<img src="https://pikwizard.com/pw/medium/bcccf30bee45a8e215ff370717e4d68e.jpg" style="margin: 0; width: 100%;" alt="" />
<p style="font-size: 12px; margin: 0;">PikWizard</p>
</a>
</span>
</span>
Free (free of charge)
Free for personal and commercial use.
Author: Awesome Content