- Home >
- Stock Photos >
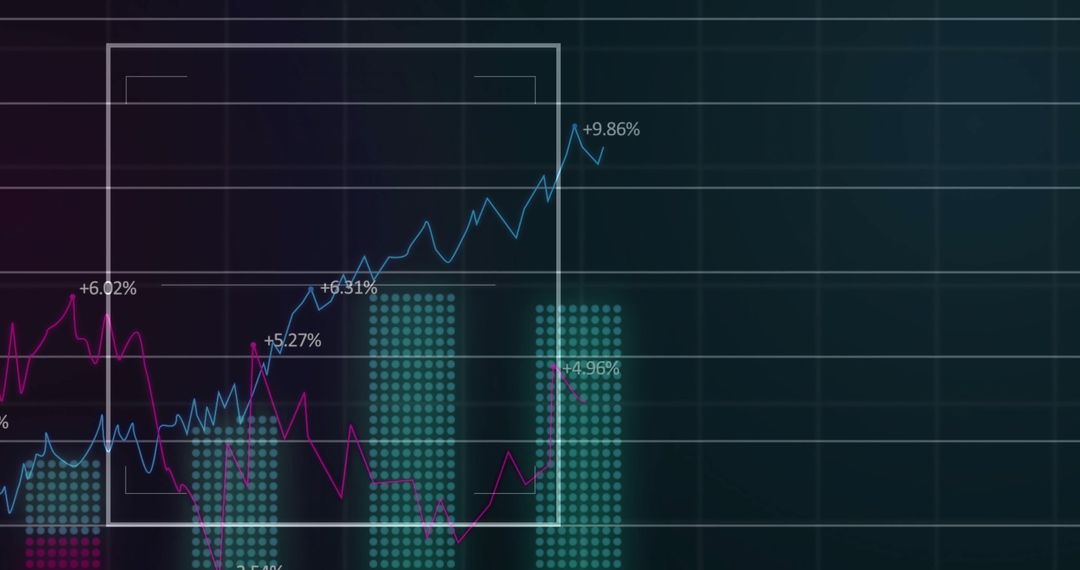
- Visualizing market volatility on navy gradient with magenta and blue trend lines, copy space
Visualizing market volatility on navy gradient with magenta and blue trend lines, copy space Image

Left-aligned market chart on navy gradient featuring magenta and blue trend lines, percentage markers, dotted column indicators, and horizontal gridlines. Clean right-side copy space allowing headline or data overlay placement for brand messaging. Ideal for presenting financial reports, illustrating stock performance, and explaining market analytics in investor decks or business articles. Useful for designing dashboard mockups, website hero banners, trading newsletters, social posts, and corporate presentations. Editable for adding annotations, custom metrics, or brand colors while supporting modern finance and tech themes.
Powered by 


0
downloads
downloads
Tags:
More
Credit Photo
If you would like to credit the Photo, here are some ways you can do so
Text Link
photo Link
<span class="text-link">
<span>
<a target="_blank" href=https://pikwizard.com/photo/visualizing-market-volatility-on-navy-gradient-with-magenta-and-blue-trend-lines-copy-space/c8a2813ecb7e40e850b76657975df42e/>PikWizard</a>
</span>
</span>
<span class="image-link">
<span
style="margin: 0 0 20px 0; display: inline-block; vertical-align: middle; width: 100%;"
>
<a
target="_blank"
href="https://pikwizard.com/photo/visualizing-market-volatility-on-navy-gradient-with-magenta-and-blue-trend-lines-copy-space/c8a2813ecb7e40e850b76657975df42e/"
style="text-decoration: none; font-size: 10px; margin: 0;"
>
<img src="https://pikwizard.com/pw/medium/c8a2813ecb7e40e850b76657975df42e.jpg" style="margin: 0; width: 100%;" alt="" />
<p style="font-size: 12px; margin: 0;">PikWizard</p>
</a>
</span>
</span>
Free (free of charge)
Free for personal and commercial use.
Author: Authentic Images
Similar Free Stock Images

Premium


Premium


Premium


Premium


Premium


Premium


Premium


Premium


Premium


Premium


Premium


Premium


Premium


Premium


Premium


Premium


Premium


Premium


Premium


Premium


Premium


Premium


Premium


Premium