- Home >
- Stock Photos >
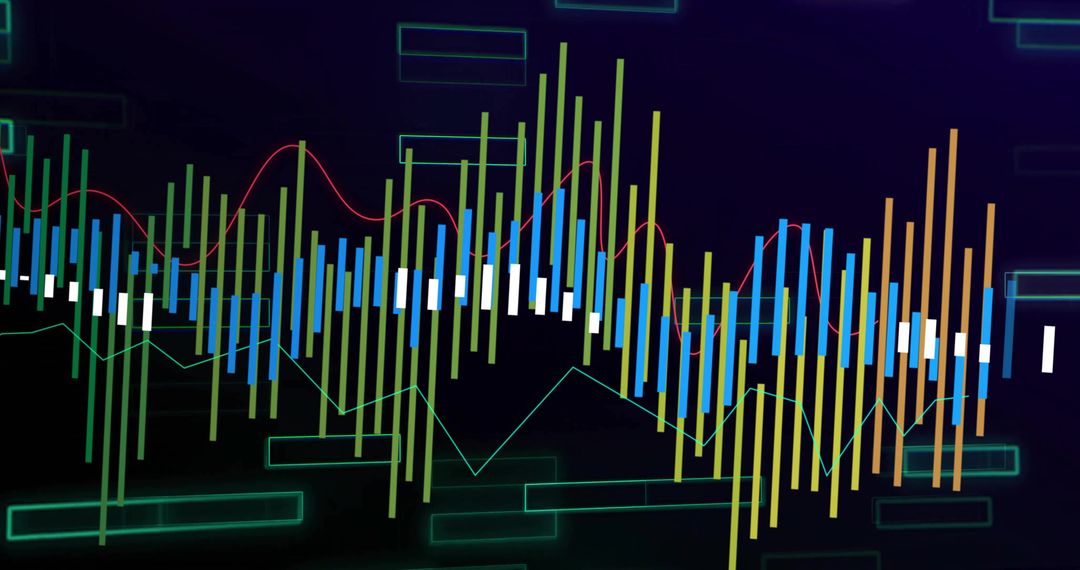
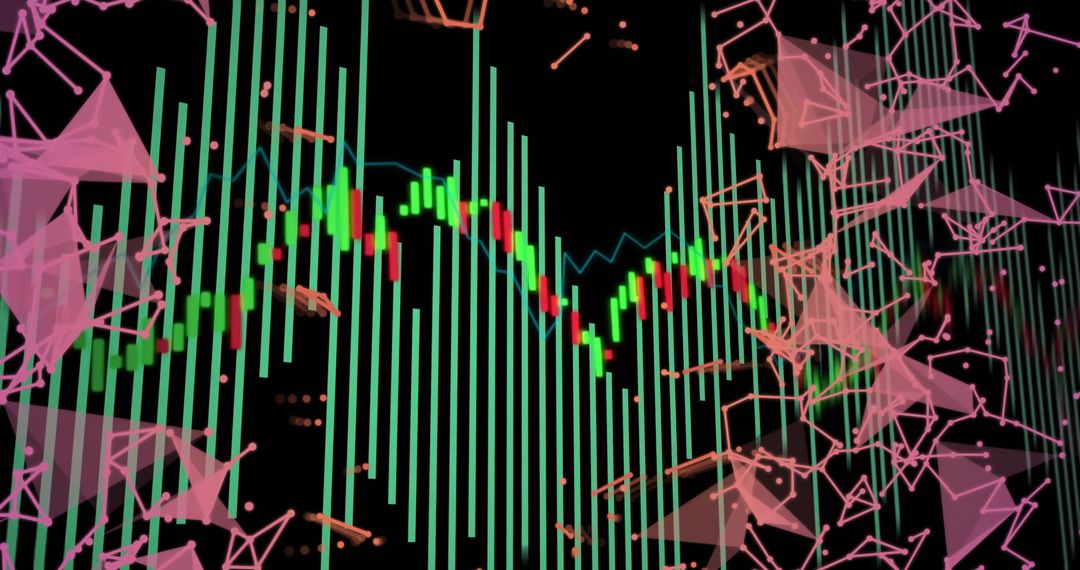
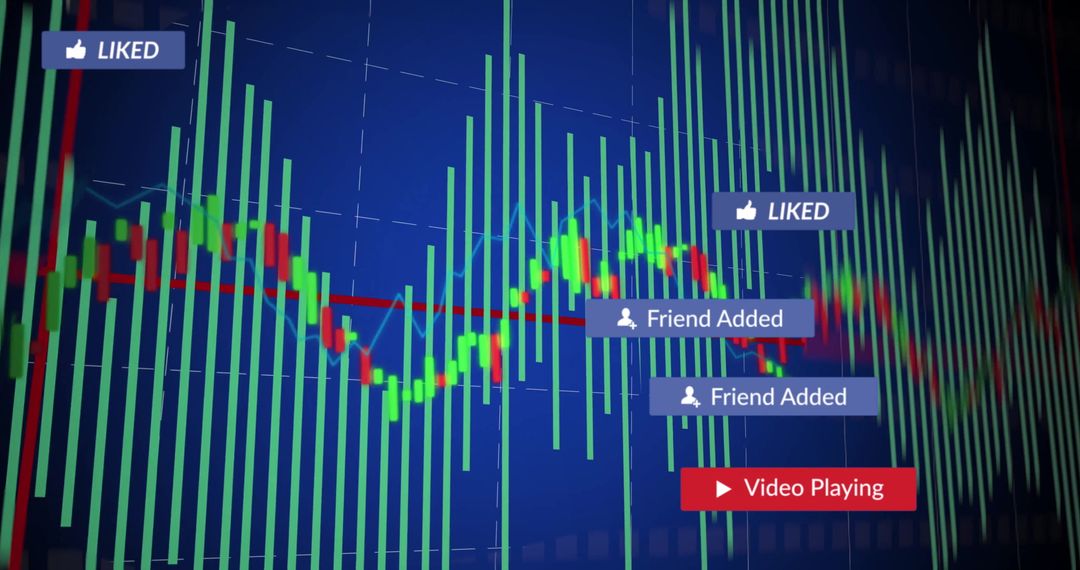
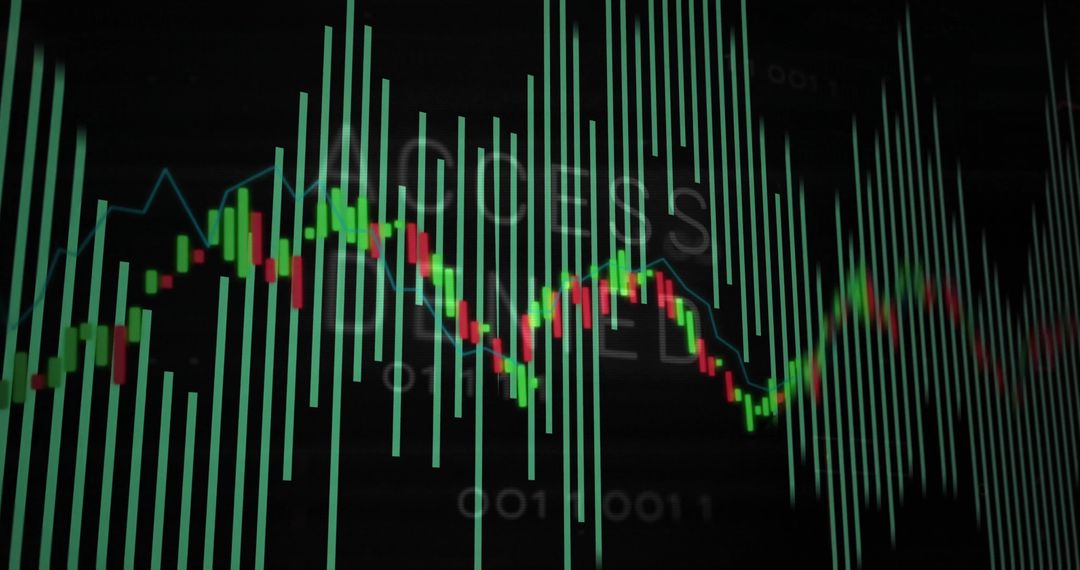
- Visualizing Neon Financial Candlestick Chart with Cyan Volume Bars and Bollinger Bands
Visualizing Neon Financial Candlestick Chart with Cyan Volume Bars and Bollinger Bands Image

Vibrant neon blue candlestick chart showing red and green candles overlaid with cyan vertical volume bars and beige trend bands. Multiple horizontal and vertical gridlines and subtle glow conveying high-tech market interface and real-time data visualization. Ideal for illustrating market volatility, price action, and technical indicators in finance content. Use for fintech website headers, trading platform UI mockups, market analysis reports, cryptocurrency and forex articles, investor presentations, social media banners, and video backgrounds. Combine with infographic text, data callouts, or overlayed charts to create engaging educational material and marketing assets for trading tools and financial services.
Powered by  - Get 15% off with code: PIKWIZARD15


0
downloads
downloads
Tags:
More
Credit Photo
If you would like to credit the Photo, here are some ways you can do so
Text Link
photo Link
<span class="text-link">
<span>
<a target="_blank" href=https://pikwizard.com/photo/visualizing-neon-financial-candlestick-chart-with-cyan-volume-bars-and-bollinger-bands/a5186db8bb9eda3c67313d444f072318/>PikWizard</a>
</span>
</span>
<span class="image-link">
<span
style="margin: 0 0 20px 0; display: inline-block; vertical-align: middle; width: 100%;"
>
<a
target="_blank"
href="https://pikwizard.com/photo/visualizing-neon-financial-candlestick-chart-with-cyan-volume-bars-and-bollinger-bands/a5186db8bb9eda3c67313d444f072318/"
style="text-decoration: none; font-size: 10px; margin: 0;"
>
<img src="https://pikwizard.com/pw/medium/a5186db8bb9eda3c67313d444f072318.jpg" style="margin: 0; width: 100%;" alt="" />
<p style="font-size: 12px; margin: 0;">PikWizard</p>
</a>
</span>
</span>
Free (free of charge)
Free for personal and commercial use.
Author: Awesome Content
Similar Free Stock Images

Premium


Premium


Premium


Premium


Premium


Premium


Premium


Premium


Premium


Premium


Premium


Premium


Premium


Premium


Premium


Premium


Premium


Premium


Premium


Premium


Premium


Premium


Premium


Premium