
- Home >
- Stock Photos >
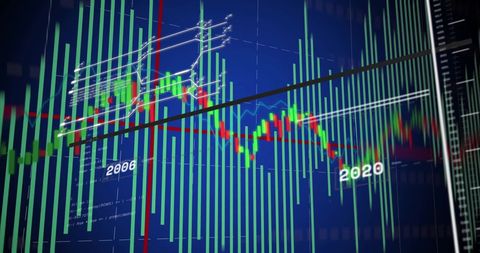
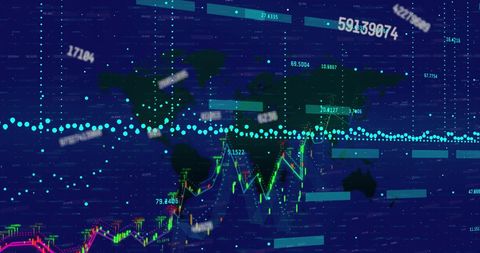
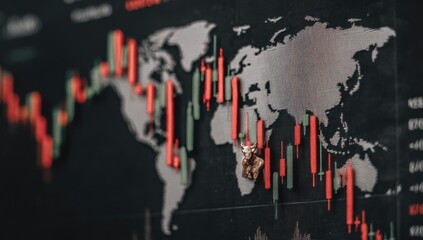
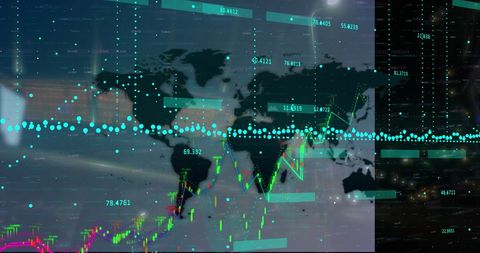
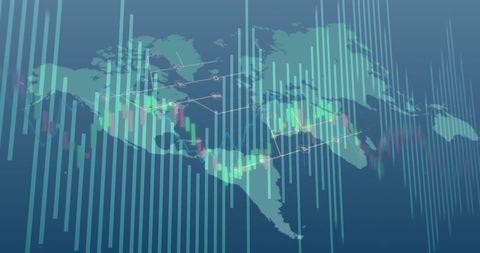
- World Map and Financial Data Interface with Candlesticks
World Map and Financial Data Interface with Candlesticks Image
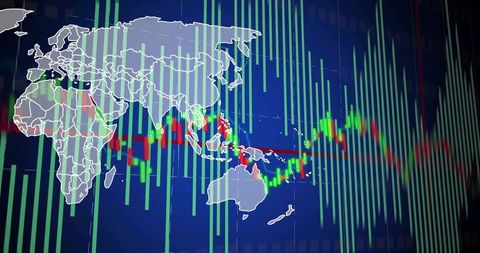
Illustrating global economic data through an engaging interface that combines a world map with investment metrics. Useful for presentations on international finance, economic analytics, and digital currency exploration.
Powered by 


downloads
Tags:
More
Credit Photo
If you would like to credit the Photo, here are some ways you can do so
Text Link
photo Link
<span class="text-link">
<span>
<a target="_blank" href=https://pikwizard.com/photo/world-map-and-financial-data-interface-with-candlesticks/3b3adf55c1fa9536563c75b3511b7a87/>PikWizard</a>
</span>
</span>
<span class="image-link">
<span
style="margin: 0 0 20px 0; display: inline-block; vertical-align: middle; width: 100%;"
>
<a
target="_blank"
href="https://pikwizard.com/photo/world-map-and-financial-data-interface-with-candlesticks/3b3adf55c1fa9536563c75b3511b7a87/"
style="text-decoration: none; font-size: 10px; margin: 0;"
>
<img src="https://pikwizard.com/pw/medium/3b3adf55c1fa9536563c75b3511b7a87.jpg" style="margin: 0; width: 100%;" alt="" />
<p style="font-size: 12px; margin: 0;">PikWizard</p>
</a>
</span>
</span>
Free (free of charge)
Free for personal and commercial use.
Author: Awesome Content
Similar Free Stock Images
Premium


Premium

Premium


Premium


Premium


Premium


Premium


Premium


Premium


Premium


Premium
Premium


Premium


Premium

Premium

Premium


Premium


Premium


Premium


Premium

Premium


Premium


Premium


Premium


Premium


Explore More Free Stock Images