
- Home >
- Stock Videos >
- Data Processing Animation with Graphs and Charts on White
Data Processing Animation with Graphs and Charts on White Video
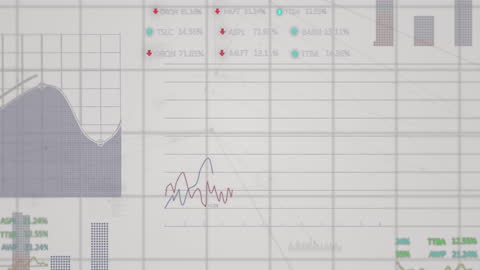
Visualizing data processing with various graphs and charts in a technology-driven context. Ideal for showcasing business analytics, the advancement of financial systems, or modern information technology services. Useful for educational videos and presentations on data analysis and global business networks.
Powered by  - Get 15% off with code: PIKWIZARD15


downloads
Tags:
More
Credit Photo
If you would like to credit the Photo, here are some ways you can do so
Text Link
video Link
<span class="text-link">
<span>
<a target="_blank" href=https://pikwizard.com/video/data-processing-animation-with-graphs-and-charts-on-white/18b24b878b6a280f1133242228ecac67/>PikWizard</a>
</span>
</span>
<span class="image-link">
<span
style="margin: 0 0 20px 0; display: inline-block; vertical-align: middle; width: 100%;"
>
<a
target="_blank"
href="https://pikwizard.com/video/data-processing-animation-with-graphs-and-charts-on-white/18b24b878b6a280f1133242228ecac67/"
style="text-decoration: none; font-size: 10px; margin: 0;"
>
<video controls style="width: 100%; margin: 0;">
<source src="https://player.vimeo.com/progressive_redirect/playback/758880077/rendition/240p/file.mp4?loc=external&oauth2_token_id=1223210874&signature=e3647b5e6b894fb62b0bb014b8ce88579b8e338465929a8540c0ff332a847390" type="video/mp4"
poster="https://pikwizard.com/pw/medium/18b24b878b6a280f1133242228ecac67.jpg"/>
Your browser does not support the video tag.
</video>
<p style="font-size: 12px; margin: 0;">PikWizard</p>
</a>
</span>
</span>
Free (free of charge)
Free for personal and commercial use.
Author: Awesome Content