
- Home >
- Free Stock Videos >
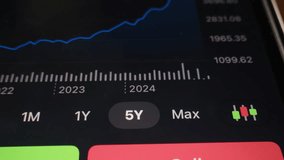
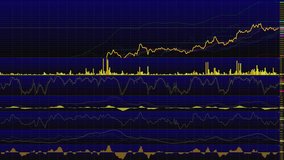
- Financial Stock Market Data with Graphs on Screen Display
Financial Stock Market Data with Graphs on Screen Display Free Stock Video
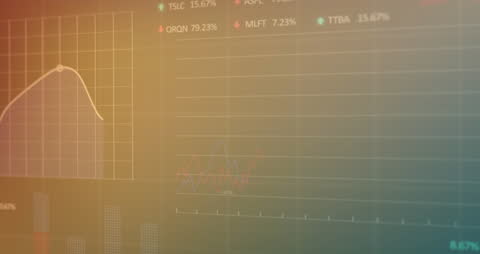
Screen displays financial stock market data with color-coded graphs, showcasing economic trends and stock performances. Useful for presentations on global finance insights, economic analysis seminars, or as a backdrop for business-related video content.
Powered by  - Get 15% off with code: PIKWIZARD15


downloads
Tags:
More
Credit Photo
If you would like to credit the Photo, here are some ways you can do so
Text Link
video Link
<span class="text-link">
<span>
<a target="_blank" href=https://pikwizard.com/video/financial-stock-market-data-with-graphs-on-screen-display/6ac8361025408750aeba6ca037d1e86c/>PikWizard</a>
</span>
</span>
<span class="image-link">
<span
style="margin: 0 0 20px 0; display: inline-block; vertical-align: middle; width: 100%;"
>
<a
target="_blank"
href="https://pikwizard.com/video/financial-stock-market-data-with-graphs-on-screen-display/6ac8361025408750aeba6ca037d1e86c/"
style="text-decoration: none; font-size: 10px; margin: 0;"
>
<video controls style="width: 100%; margin: 0;">
<source src="https://player.vimeo.com/progressive_redirect/playback/829692383/rendition/240p/file.mp4?loc=external&oauth2_token_id=1223210874&signature=42354c17484601f1c93f77581f422be87f41a5e879df1424a0b6ffc18bf0c6fb" type="video/mp4"
poster="https://thumbs.wbm.im/pw/medium/6ac8361025408750aeba6ca037d1e86c.jpg"/>
Your browser does not support the video tag.
</video>
<p style="font-size: 12px; margin: 0;">PikWizard</p>
</a>
</span>
</span>
Free (free of charge)
Free for personal and commercial use.
Author: Awesome Content