
- Home >
- Free Stock Videos >
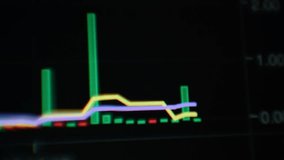
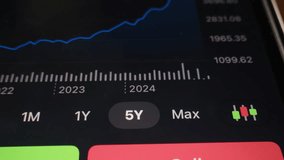
- Dynamic Financial Graphs and Trading Data on Gradient Background
Dynamic Financial Graphs and Trading Data on Gradient Background Free Stock Video

Colorful graphs and changing trading data create a modern financial concept. Useful for illustrating investment trends, stock exchange methods, and economic analysis. Ideal for presentations about financial services, business strategies, or economic forecasts.
Powered by  - Get 15% off with code: PIKWIZARD15


downloads
Tags:
More
Credit Photo
If you would like to credit the Photo, here are some ways you can do so
Text Link
video Link
<span class="text-link">
<span>
<a target="_blank" href=https://pikwizard.com/video/dynamic-financial-graphs-and-trading-data-on-gradient-background/8b0d4eae3be78578a2dbbc54d23bee75/>PikWizard</a>
</span>
</span>
<span class="image-link">
<span
style="margin: 0 0 20px 0; display: inline-block; vertical-align: middle; width: 100%;"
>
<a
target="_blank"
href="https://pikwizard.com/video/dynamic-financial-graphs-and-trading-data-on-gradient-background/8b0d4eae3be78578a2dbbc54d23bee75/"
style="text-decoration: none; font-size: 10px; margin: 0;"
>
<video controls style="width: 100%; margin: 0;">
<source src="https://player.vimeo.com/progressive_redirect/playback/857036278/rendition/720p/file.mp4?loc=external&oauth2_token_id=1223210874&signature=39a70cd401326050a3bf90402532a27d322783660ce642ec92a99b4cd5c9651e" type="video/mp4"
poster="https://thumbs.wbm.im/pw/medium/8b0d4eae3be78578a2dbbc54d23bee75.jpg"/>
Your browser does not support the video tag.
</video>
<p style="font-size: 12px; margin: 0;">PikWizard</p>
</a>
</span>
</span>
Free (free of charge)
Free for personal and commercial use.
Author: Awesome Content