
- Home >
- Free Stock Videos >
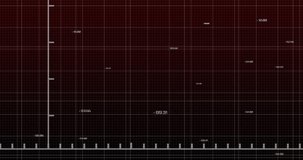
- Visualizing Economic Downturn with Trend Line and Percentages
Visualizing Economic Downturn with Trend Line and Percentages Free Stock Video

This illustrates a downturn in the economic or financial market. Bars projecting with a red declining arrow indicate market losses. Dynamic ticker texts display real-time updates implying technological finance. Useful for presentations or materials discussing market decline, financial analysis, and economic impact studies.
Powered by  - Get 15% off with code: PIKWIZARD15


downloads
Tags:
More
Credit Photo
If you would like to credit the Photo, here are some ways you can do so
Text Link
video Link
<span class="text-link">
<span>
<a target="_blank" href=https://pikwizard.com/video/visualizing-economic-downturn-with-trend-line-and-percentages/32759a60328d63c5665129dd8afcb2c4/>PikWizard</a>
</span>
</span>
<span class="image-link">
<span
style="margin: 0 0 20px 0; display: inline-block; vertical-align: middle; width: 100%;"
>
<a
target="_blank"
href="https://pikwizard.com/video/visualizing-economic-downturn-with-trend-line-and-percentages/32759a60328d63c5665129dd8afcb2c4/"
style="text-decoration: none; font-size: 10px; margin: 0;"
>
<video controls style="width: 100%; margin: 0;">
<source src="https://player.vimeo.com/progressive_redirect/playback/1105837316/rendition/240p/file.mp4?loc=external&oauth2_token_id=1223210874&signature=d06daedd4d6056f092b044285c478eea8c4c8fbf999dff95bbf539a05ac14cc7" type="video/mp4"
poster="https://thumbs.wbm.im/pw/medium/32759a60328d63c5665129dd8afcb2c4.jpg"/>
Your browser does not support the video tag.
</video>
<p style="font-size: 12px; margin: 0;">PikWizard</p>
</a>
</span>
</span>
Free (free of charge)
Free for personal and commercial use.
Author: Awesome Content