
- Home >
- Stock Videos >
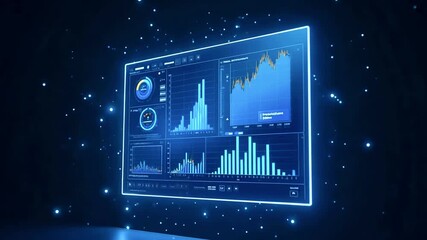
- Digital Interface with Animated Financial Charts
Digital Interface with Animated Financial Charts Video

Modern depiction of a digital interface displaying financial charts, pie diagrams, and statistical data, merging seamlessly with a futuristic cityscape. Ideal use in presentations, articles on business and economy trends, financial reports, or digital marketing campaigns emphasizing analytics and growth.
Powered by 


downloads
Tags:
More
Credit Photo
If you would like to credit the Photo, here are some ways you can do so
Text Link
video Link
<span class="text-link">
<span>
<a target="_blank" href=https://pikwizard.com/video/digital-interface-with-animated-financial-charts/485e4e621f276ef800f18bff7cad5b2e/>PikWizard</a>
</span>
</span>
<span class="image-link">
<span
style="margin: 0 0 20px 0; display: inline-block; vertical-align: middle; width: 100%;"
>
<a
target="_blank"
href="https://pikwizard.com/video/digital-interface-with-animated-financial-charts/485e4e621f276ef800f18bff7cad5b2e/"
style="text-decoration: none; font-size: 10px; margin: 0;"
>
<video controls style="width: 100%; margin: 0;">
<source src="https://player.vimeo.com/progressive_redirect/playback/911718454/rendition/240p/file.mp4?loc=external&oauth2_token_id=1223210874&signature=c0c6b70e555c0abde93c90b22a9251921718b4a5e4aba006395b51e7847495cb" type="video/mp4"
poster="https://pikwizard.com/pw/medium/485e4e621f276ef800f18bff7cad5b2e.jpg"/>
Your browser does not support the video tag.
</video>
<p style="font-size: 12px; margin: 0;">PikWizard</p>
</a>
</span>
</span>
Free (free of charge)
Free for personal and commercial use.
Author: Awesome Content