
- Home >
- Stock Videos >
- Digital Stock Market Display with Candlestick Chart and Data Overlay
Digital Stock Market Display with Candlestick Chart and Data Overlay Video
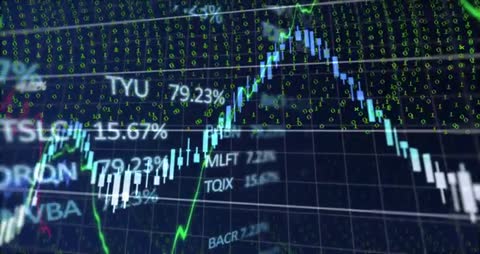
This visual can be utilized in presentations or articles related to stock market analysis, digital finance technologies, and investment strategies. It highlights complex financial data including candlestick charts, a green trend line, and floating binary code, offering insight for tech-driven financial solutions and educational materials.
Powered by 


0
downloads
downloads
Tags:
More
Credit Photo
If you would like to credit the Photo, here are some ways you can do so
Text Link
video Link
<span class="text-link">
<span>
<a target="_blank" href=https://pikwizard.com/video/digital-stock-market-display-with-candlestick-chart-and-data-overlay/1a0dbb1583f5485713c1c6f5dbf33bd4/>PikWizard</a>
</span>
</span>
<span class="image-link">
<span
style="margin: 0 0 20px 0; display: inline-block; vertical-align: middle; width: 100%;"
>
<a
target="_blank"
href="https://pikwizard.com/video/digital-stock-market-display-with-candlestick-chart-and-data-overlay/1a0dbb1583f5485713c1c6f5dbf33bd4/"
style="text-decoration: none; font-size: 10px; margin: 0;"
>
<video controls style="width: 100%; margin: 0;">
<source src="https://player.vimeo.com/progressive_redirect/playback/1084178237/rendition/240p/file.mp4?loc=external&oauth2_token_id=1223210874&signature=b1216b7df6bcead51eb292313b1aa237b786132eb05fc269fb99e97292d153b1" type="video/mp4"
poster="https://pikwizard.com/pw/medium/1a0dbb1583f5485713c1c6f5dbf33bd4.jpg"/>
Your browser does not support the video tag.
</video>
<p style="font-size: 12px; margin: 0;">PikWizard</p>
</a>
</span>
</span>
Free (free of charge)
Free for personal and commercial use.
Author: Awesome Content