
- Home >
- Stock Videos >
- Dynamic Data Visualization with Interactive Social Media Updates
Dynamic Data Visualization with Interactive Social Media Updates Video

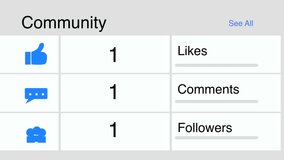
This video showcases dynamic data visualization with a bar and line chart that is augmented by interactive social media icons, representing data changes as updates occur. Designed for those needing insights into technology trends and data analytics, it is an excellent tool for presentations and educational content, as well as for use in creating engaging dashboards that highlight the power of data interactivity and storytelling through visuals.
Powered by  - Get 15% off with code: PIKWIZARD15


downloads
Tags:
More
Credit Photo
If you would like to credit the Photo, here are some ways you can do so
Text Link
video Link
<span class="text-link">
<span>
<a target="_blank" href=https://pikwizard.com/video/dynamic-data-visualization-with-interactive-social-media-updates/1bcbab61ff121df686e985ae90624d4a/>PikWizard</a>
</span>
</span>
<span class="image-link">
<span
style="margin: 0 0 20px 0; display: inline-block; vertical-align: middle; width: 100%;"
>
<a
target="_blank"
href="https://pikwizard.com/video/dynamic-data-visualization-with-interactive-social-media-updates/1bcbab61ff121df686e985ae90624d4a/"
style="text-decoration: none; font-size: 10px; margin: 0;"
>
<video controls style="width: 100%; margin: 0;">
<source src="https://player.vimeo.com/progressive_redirect/playback/1129241634/rendition/240p/file.mp4?loc=external&oauth2_token_id=1223210874&signature=f2770dd82bc94bbeb95f82128d783a7b1641f579e79c24350c5cba43e0dcc754" type="video/mp4"
poster="https://pikwizard.com/pw/medium/1bcbab61ff121df686e985ae90624d4a.jpg"/>
Your browser does not support the video tag.
</video>
<p style="font-size: 12px; margin: 0;">PikWizard</p>
</a>
</span>
</span>
Free (free of charge)
Free for personal and commercial use.
Author: Awesome Content