
- Home >
- Stock Videos >
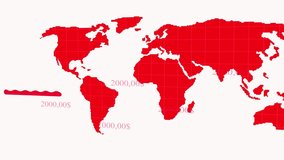
- Dynamic Financial Data Overlay on Cyber World Map
Dynamic Financial Data Overlay on Cyber World Map Video

Visualization of financial data and streaming numbers overlaid on a digital representation of a world map. Useful for illustrating concepts of global finance, stock market dynamics, business analytics, and the abstract flow of information across international landscapes. Applicable in tech blogs, financial publications, presentations highlighting economic trends, and educational materials focusing on global economic activities.
Powered by  - Get 15% off with code: PIKWIZARD15


6
downloads
downloads
Tags:
More
Credit Photo
If you would like to credit the Photo, here are some ways you can do so
Text Link
video Link
<span class="text-link">
<span>
<a target="_blank" href=https://pikwizard.com/video/dynamic-financial-data-overlay-on-cyber-world-map/a27f7b213a5ee7677b29820323fe4159/>PikWizard</a>
</span>
</span>
<span class="image-link">
<span
style="margin: 0 0 20px 0; display: inline-block; vertical-align: middle; width: 100%;"
>
<a
target="_blank"
href="https://pikwizard.com/video/dynamic-financial-data-overlay-on-cyber-world-map/a27f7b213a5ee7677b29820323fe4159/"
style="text-decoration: none; font-size: 10px; margin: 0;"
>
<video controls style="width: 100%; margin: 0;">
<source src="https://player.vimeo.com/progressive_redirect/playback/726556905/rendition/240p/file.mp4?loc=external&oauth2_token_id=1223210874&signature=ce58758520ba2b3b62773b949355d2bf4b317b00b2875d1a0561414be3f16da7" type="video/mp4"
poster="https://pikwizard.com/pw/medium/a27f7b213a5ee7677b29820323fe4159.jpg"/>
Your browser does not support the video tag.
</video>
<p style="font-size: 12px; margin: 0;">PikWizard</p>
</a>
</span>
</span>
Free (free of charge)
Free for personal and commercial use.
Author: Awesome Content