
- Home >
- Stock Videos >
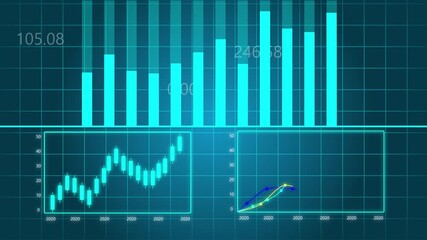
- Dynamic Visualization of AI-Generated Data Analytics
Dynamic Visualization of AI-Generated Data Analytics Video

AI
AI Generated Video. A vivid video scene reveals animated graphs and candlestick charts on glowing digital interfaces in a tech-driven control space. Perfect for showcasing themes related to digital transformation, AI analytics, and modern data science. Ideal for use in presentations, educational content on data visualization techniques, or a technology conference backdrop.
Powered by 


downloads
Tags:
More
Credit Photo
If you would like to credit the Photo, here are some ways you can do so
Text Link
video Link
<span class="text-link">
<span>
<a target="_blank" href=https://pikwizard.com/video/dynamic-visualization-of-ai-generated-data-analytics/2eb4c40ae254e77682842af45087b104/>PikWizard</a>
</span>
</span>
<span class="image-link">
<span
style="margin: 0 0 20px 0; display: inline-block; vertical-align: middle; width: 100%;"
>
<a
target="_blank"
href="https://pikwizard.com/video/dynamic-visualization-of-ai-generated-data-analytics/2eb4c40ae254e77682842af45087b104/"
style="text-decoration: none; font-size: 10px; margin: 0;"
>
<video controls style="width: 100%; margin: 0;">
<source src="https://player.vimeo.com/progressive_redirect/playback/1129592116/rendition/240p/file.mp4?loc=external&oauth2_token_id=1223210874&signature=9fe72a2f4af0ae32c422a49a01598b7920582012deb0f247521b67a909a6f72b" type="video/mp4"
poster="https://pikwizard.com/pw/medium/2eb4c40ae254e77682842af45087b104.jpg"/>
Your browser does not support the video tag.
</video>
<p style="font-size: 12px; margin: 0;">PikWizard</p>
</a>
</span>
</span>
Free (free of charge)
Free for personal and commercial use.
Author: AI Creator