
- Home >
- Stock Videos >
- Financial Data Visualization with Graphs and Percentages
Financial Data Visualization with Graphs and Percentages Video
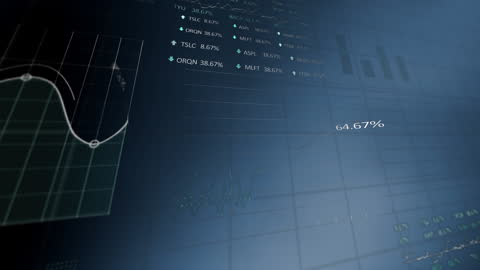
Visualization showing multiple financial graph elements such as line graphs, data plots, and percentage figures. Useful for illustrating financial analysis, market trends, and investment strategies presentations or articles on digital computation methods in global business contexts.
Powered by  - Get 15% off with code: PIKWIZARD15


downloads
Tags:
More
Credit Photo
If you would like to credit the Photo, here are some ways you can do so
Text Link
video Link
<span class="text-link">
<span>
<a target="_blank" href=https://pikwizard.com/video/financial-data-visualization-with-graphs-and-percentages/1eaae91cb3a4c48dab3b4509fc450cfd/>PikWizard</a>
</span>
</span>
<span class="image-link">
<span
style="margin: 0 0 20px 0; display: inline-block; vertical-align: middle; width: 100%;"
>
<a
target="_blank"
href="https://pikwizard.com/video/financial-data-visualization-with-graphs-and-percentages/1eaae91cb3a4c48dab3b4509fc450cfd/"
style="text-decoration: none; font-size: 10px; margin: 0;"
>
<video controls style="width: 100%; margin: 0;">
<source src="https://player.vimeo.com/progressive_redirect/playback/841425977/rendition/240p/file.mp4?loc=external&oauth2_token_id=1223210874&signature=a6d2ab2ae853d5733d0eb8f7be277ed28e85c3c040fb78927389a24f7b09dc14" type="video/mp4"
poster="https://pikwizard.com/pw/medium/1eaae91cb3a4c48dab3b4509fc450cfd.jpg"/>
Your browser does not support the video tag.
</video>
<p style="font-size: 12px; margin: 0;">PikWizard</p>
</a>
</span>
</span>
Free (free of charge)
Free for personal and commercial use.
Author: Awesome Content