
- Home >
- Stock Videos >
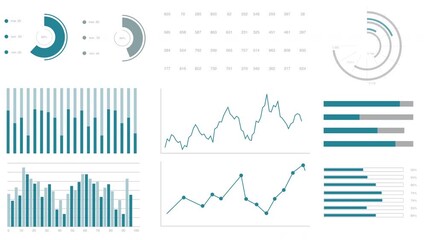
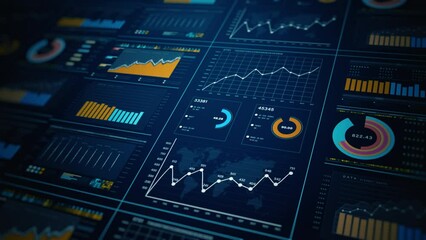
- Futuristic Financial Graphs and Data in Motion
Futuristic Financial Graphs and Data in Motion Video
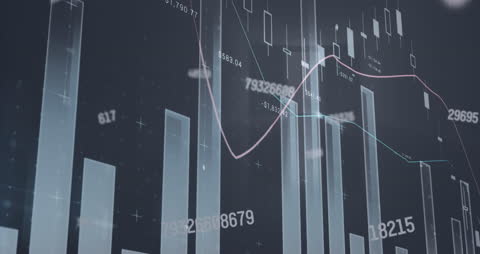
Vibrant financial graphs illustrate complex market trends in a dynamic setting, emphasizing modern digital analysis tools. Suited for financial presentations and education about the global economy and trading systems.
Powered by 


downloads
Tags:
More
Credit Photo
If you would like to credit the Photo, here are some ways you can do so
Text Link
video Link
<span class="text-link">
<span>
<a target="_blank" href=https://pikwizard.com/video/futuristic-financial-graphs-and-data-in-motion/ff7debe3a710d376655bd5638c4cda88/>PikWizard</a>
</span>
</span>
<span class="image-link">
<span
style="margin: 0 0 20px 0; display: inline-block; vertical-align: middle; width: 100%;"
>
<a
target="_blank"
href="https://pikwizard.com/video/futuristic-financial-graphs-and-data-in-motion/ff7debe3a710d376655bd5638c4cda88/"
style="text-decoration: none; font-size: 10px; margin: 0;"
>
<video controls style="width: 100%; margin: 0;">
<source src="https://player.vimeo.com/progressive_redirect/playback/817810917/rendition/240p/file.mp4?loc=external&oauth2_token_id=1223210874&signature=53e2fa78214262c239d8d56a581d635c359776f284b5601de41083b7c77a26a4" type="video/mp4"
poster="https://pikwizard.com/pw/medium/ff7debe3a710d376655bd5638c4cda88.jpg"/>
Your browser does not support the video tag.
</video>
<p style="font-size: 12px; margin: 0;">PikWizard</p>
</a>
</span>
</span>
Free (free of charge)
Free for personal and commercial use.
Author: Awesome Content