
- Home >
- Stock Videos >
- Global Data Streams Visualization With World Map Overlay
Global Data Streams Visualization With World Map Overlay Video
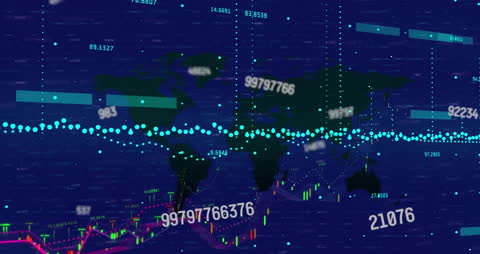
Animated representation of global data processing with an integrated world map is depicting financial patterns and trends. Constant flow of numbers suggests live data capabilities, making it ideal for presentation media, financial analysis demonstrations, or educational tools showcasing global market dynamics.

downloads
Tags:
More
Credit Photo
If you would like to credit the Photo, here are some ways you can do so
Text Link
video Link
<span class="text-link">
<span>
<a target="_blank" href=https://pikwizard.com/video/global-data-streams-visualization-with-world-map-overlay/0531a24f34c5440230acdfd14d5fecbf/>PikWizard</a>
</span>
</span>
<span class="image-link">
<span
style="margin: 0 0 20px 0; display: inline-block; vertical-align: middle; width: 100%;"
>
<a
target="_blank"
href="https://pikwizard.com/video/global-data-streams-visualization-with-world-map-overlay/0531a24f34c5440230acdfd14d5fecbf/"
style="text-decoration: none; font-size: 10px; margin: 0;"
>
<video controls style="width: 100%; margin: 0;">
<source src="https://player.vimeo.com/progressive_redirect/playback/894157693/rendition/240p/file.mp4?loc=external&oauth2_token_id=1223210874&signature=b6ae8fbeaa4de7422345855e3f431462830f4860004eeaf0b4c6ddd02bd02b68" type="video/mp4"
poster="https://pikwizard.com/pw/medium/0531a24f34c5440230acdfd14d5fecbf.jpg"/>
Your browser does not support the video tag.
</video>
<p style="font-size: 12px; margin: 0;">PikWizard</p>
</a>
</span>
</span>
Free (free of charge)
Free for personal and commercial use.
Author: Awesome Content