
- Home >
- Stock Videos >
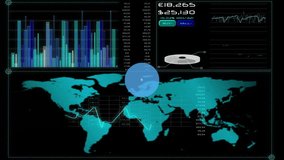
- Global Financial Data with Dynamic World Map and Graph Analysis
Global Financial Data with Dynamic World Map and Graph Analysis Video

Illustrates global finance and economy concepts with an abstract visual of a world map overlayed by fluctuating graphs and numerical data. Useful for presentations on economics, articles related to global markets or educational resources explaining financial statistics.
Powered by  - Get 15% off with code: PIKWIZARD15


downloads
Tags:
More
Credit Photo
If you would like to credit the Photo, here are some ways you can do so
Text Link
video Link
<span class="text-link">
<span>
<a target="_blank" href=https://pikwizard.com/video/global-financial-data-with-dynamic-world-map-and-graph-analysis/8d13a76bbcc4d08611fff7b953f5147c/>PikWizard</a>
</span>
</span>
<span class="image-link">
<span
style="margin: 0 0 20px 0; display: inline-block; vertical-align: middle; width: 100%;"
>
<a
target="_blank"
href="https://pikwizard.com/video/global-financial-data-with-dynamic-world-map-and-graph-analysis/8d13a76bbcc4d08611fff7b953f5147c/"
style="text-decoration: none; font-size: 10px; margin: 0;"
>
<video controls style="width: 100%; margin: 0;">
<source src="https://player.vimeo.com/progressive_redirect/playback/767261070/rendition/360p/file.mp4?loc=external&oauth2_token_id=1223210874&signature=6650c3bca8644a533c91958e02bdc82ac6013b39273ce449a28fae377f8d6782" type="video/mp4"
poster="https://pikwizard.com/pw/medium/8d13a76bbcc4d08611fff7b953f5147c.jpg"/>
Your browser does not support the video tag.
</video>
<p style="font-size: 12px; margin: 0;">PikWizard</p>
</a>
</span>
</span>
Free (free of charge)
Free for personal and commercial use.
Author: Awesome Content