
- Home >
- Stock Videos >
- Global Financial Trading with Digital Graphs and World Map
Global Financial Trading with Digital Graphs and World Map Video
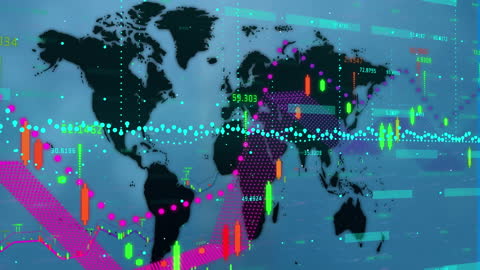
This visual shows an intertwining of digital financial graphs with a global map, symbolizing worldwide economic activity and data analysis. Ideal for illustrating concepts related to international finance, stock market dynamics, and technological influence on economic strategies. Perfect for use in business presentations, financial publications, and technology-driven financial education materials.
Powered by  - Get 15% off with code: PIKWIZARD15


0
downloads
downloads
Tags:
More
Credit Photo
If you would like to credit the Photo, here are some ways you can do so
Text Link
video Link
<span class="text-link">
<span>
<a target="_blank" href=https://pikwizard.com/video/global-financial-trading-with-digital-graphs-and-world-map/4a53a760172977aa5e6dba06a99cac29/>PikWizard</a>
</span>
</span>
<span class="image-link">
<span
style="margin: 0 0 20px 0; display: inline-block; vertical-align: middle; width: 100%;"
>
<a
target="_blank"
href="https://pikwizard.com/video/global-financial-trading-with-digital-graphs-and-world-map/4a53a760172977aa5e6dba06a99cac29/"
style="text-decoration: none; font-size: 10px; margin: 0;"
>
<video controls style="width: 100%; margin: 0;">
<source src="https://player.vimeo.com/progressive_redirect/playback/771336809/rendition/240p/file.mp4?loc=external&oauth2_token_id=1223210874&signature=7aae492a46a8e7c549d049597bc4d44ddee3e1784a35437d226ee49893a78bf9" type="video/mp4"
poster="https://pikwizard.com/pw/medium/4a53a760172977aa5e6dba06a99cac29.jpg"/>
Your browser does not support the video tag.
</video>
<p style="font-size: 12px; margin: 0;">PikWizard</p>
</a>
</span>
</span>
Free (free of charge)
Free for personal and commercial use.
Author: Awesome Content