
- Home >
- Stock Videos >
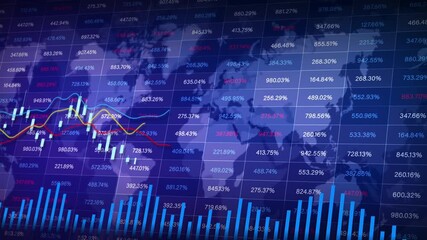
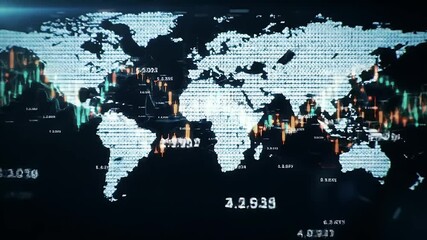
- Global Financial Trends Digital Interface with Graphs
Global Financial Trends Digital Interface with Graphs Video

Visual depicts current financial trends illustrated on a world map backdrop integrated with line and bar graphs. Ideal for use in presentations on global economics, finance analytics, investor reports, and business data visualization. Highlights real-time data interpretation and market analysis concepts.
Powered by 


downloads
Tags:
More
Credit Photo
If you would like to credit the Photo, here are some ways you can do so
Text Link
video Link
<span class="text-link">
<span>
<a target="_blank" href=https://pikwizard.com/video/global-financial-trends-digital-interface-with-graphs/debf106e11a57a82df0064495de5e970/>PikWizard</a>
</span>
</span>
<span class="image-link">
<span
style="margin: 0 0 20px 0; display: inline-block; vertical-align: middle; width: 100%;"
>
<a
target="_blank"
href="https://pikwizard.com/video/global-financial-trends-digital-interface-with-graphs/debf106e11a57a82df0064495de5e970/"
style="text-decoration: none; font-size: 10px; margin: 0;"
>
<video controls style="width: 100%; margin: 0;">
<source src="https://player.vimeo.com/progressive_redirect/playback/912747403/rendition/240p/file.mp4?loc=external&oauth2_token_id=1223210874&signature=7475ace2f5d5da4e281c213684b85bb75ae53453422c67387d695de98a305baa" type="video/mp4"
poster="https://pikwizard.com/pw/medium/debf106e11a57a82df0064495de5e970.jpg"/>
Your browser does not support the video tag.
</video>
<p style="font-size: 12px; margin: 0;">PikWizard</p>
</a>
</span>
</span>
Free (free of charge)
Free for personal and commercial use.
Author: Awesome Content