
- Home >
- Stock Videos >
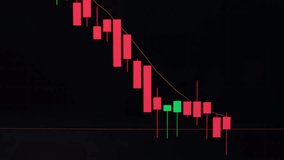
- Vertical video streaming candlestick chart displaying market decline in neon blue and pink
Vertical video streaming candlestick chart displaying market decline in neon blue and pink Video

AI Generated Image. Vertical video capturing streaming candlestick chart with neon blue and pink palette, showing downward market trend and high-frequency price fluctuations. Composing tight depth-of-field and diagonal grid lines for dynamic sense of motion and urgency. Perfect for use in trading tutorials, market analysis videos, fintech product demos, social media reels, financial news segments, investor presentations. Pairing with voiceover, data overlays, animated infographics for explaining technical indicators, risk management, market commentary. Suitable for vertical ad campaigns, mobile app backgrounds, startup pitch decks, online courses, newsroom lower thirds. Color grading and speed ramping suggestions include boosting contrast and adding subtle camera shake to enhance tension during market drops.
Powered by  - Get 15% off with code: PIKWIZARD15


0
downloads
downloads
Tags:
More
Credit Photo
If you would like to credit the Photo, here are some ways you can do so
Text Link
video Link
<span class="text-link">
<span>
<a target="_blank" href=https://pikwizard.com/video/vertical-video-streaming-candlestick-chart-displaying-market-decline-in-neon-blue-and-pink/57f82e1e8e7270cccd012270d5f4544c/>PikWizard</a>
</span>
</span>
<span class="image-link">
<span
style="margin: 0 0 20px 0; display: inline-block; vertical-align: middle; width: 100%;"
>
<a
target="_blank"
href="https://pikwizard.com/video/vertical-video-streaming-candlestick-chart-displaying-market-decline-in-neon-blue-and-pink/57f82e1e8e7270cccd012270d5f4544c/"
style="text-decoration: none; font-size: 10px; margin: 0;"
>
<video controls style="width: 100%; margin: 0;">
<source src="" type="video/mp4"
poster="https://pikwizard.com/pw/medium/57f82e1e8e7270cccd012270d5f4544c.jpg"/>
Your browser does not support the video tag.
</video>
<p style="font-size: 12px; margin: 0;">PikWizard</p>
</a>
</span>
</span>
Free (free of charge)
Free for personal and commercial use.
Author: AI Creator