
- Home >
- Stock Videos >
- Vertical Video Tilting Down Revealing Real-Time Candlestick Charts on Trading Monitors
Vertical Video Tilting Down Revealing Real-Time Candlestick Charts on Trading Monitors Video
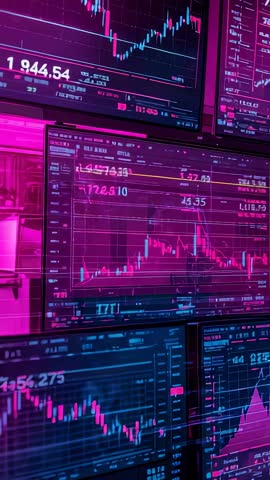
AI Generated Image. Vertical video showing camera tilting down while revealing candlestick chart updating across multiple trading monitors bathed in neon pink and blue light. Scenes capturing real-time market data, price movement, volume indicators, and technical analysis overlays. Footage suiting fintech promotions, market update reels, trading education tutorials, app demo vertical ads, social media stories, investor relations clips, and newsroom segments. Visual mood high-tech, energetic, modern, supporting narratives about algorithmic trading, crypto markets, stock analysis, and financial dashboards. Technical notes: 9:16 aspect ratio, loop-friendly segments for background motion, color grading enhancing neon tones, room for overlaid text and lower thirds, clean crop for mobile-first platforms.
Powered by  - Get 15% off with code: PIKWIZARD15


0
downloads
downloads
Tags:
More
Credit Photo
If you would like to credit the Photo, here are some ways you can do so
Text Link
video Link
<span class="text-link">
<span>
<a target="_blank" href=https://pikwizard.com/video/vertical-video-tilting-down-revealing-real-time-candlestick-charts-on-trading-monitors/b6bdf20d4ee83ebc06b5bb9b3b573492/>PikWizard</a>
</span>
</span>
<span class="image-link">
<span
style="margin: 0 0 20px 0; display: inline-block; vertical-align: middle; width: 100%;"
>
<a
target="_blank"
href="https://pikwizard.com/video/vertical-video-tilting-down-revealing-real-time-candlestick-charts-on-trading-monitors/b6bdf20d4ee83ebc06b5bb9b3b573492/"
style="text-decoration: none; font-size: 10px; margin: 0;"
>
<video controls style="width: 100%; margin: 0;">
<source src="" type="video/mp4"
poster="https://pikwizard.com/pw/medium/b6bdf20d4ee83ebc06b5bb9b3b573492.jpg"/>
Your browser does not support the video tag.
</video>
<p style="font-size: 12px; margin: 0;">PikWizard</p>
</a>
</span>
</span>
Free (free of charge)
Free for personal and commercial use.
Author: AI Creator