Download Data Graph Analytics Images Collection
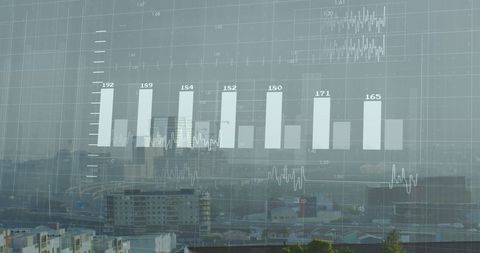
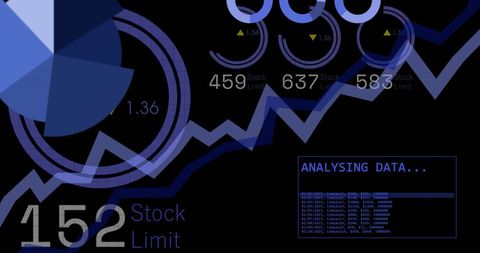
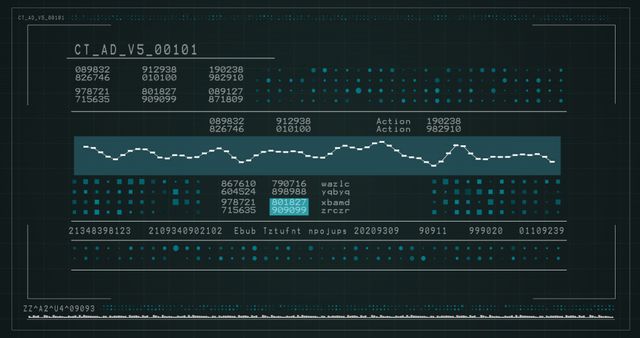
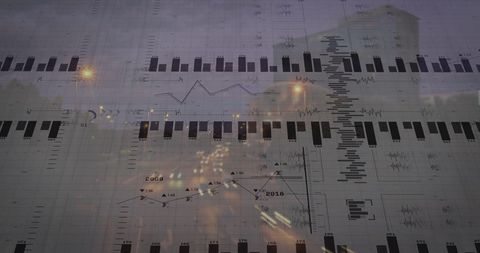
Data Graph Analytics delivers a premium stock of high-quality digital imagery that fuses modern data overlays with vibrant urban landscapes. This dynamic photos collection offers a creative blend of business analytics and futuristic visuals to enhance your visual storytelling. Elevate your projects with an engaging, transparent photos display that captures global market trends and innovative business insights.