
- Home >
- Stock Photos >
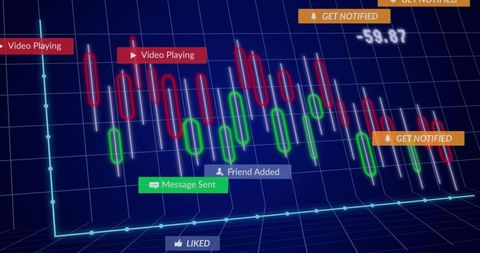
- 3D Visualization of Analytics Dashboard with Interactive Data
3D Visualization of Analytics Dashboard with Interactive Data Image

This image depicts a modern 3D analytics dashboard featuring an interactive grid layout, complete with a candlestick chart commonly used in financial markets. Social media notifications overlay the chart, showcasing the integration of diverse data inputs ranging from emails to video views. Ideal for usage in presentations or articles that focus on digital marketing, technology interfaces, financial trading systems, or innovative data solutions. Provides a futuristic visual narrative for any tech-savvy audience.
Powered by 


downloads
Tags:
More
Credit Photo
If you would like to credit the Photo, here are some ways you can do so
Text Link
photo Link
<span class="text-link">
<span>
<a target="_blank" href=https://pikwizard.com/photo/3d-visualization-of-analytics-dashboard-with-interactive-data/4108a99e0d1437151d9d08906836e07d/>PikWizard</a>
</span>
</span>
<span class="image-link">
<span
style="margin: 0 0 20px 0; display: inline-block; vertical-align: middle; width: 100%;"
>
<a
target="_blank"
href="https://pikwizard.com/photo/3d-visualization-of-analytics-dashboard-with-interactive-data/4108a99e0d1437151d9d08906836e07d/"
style="text-decoration: none; font-size: 10px; margin: 0;"
>
<img src="https://pikwizard.com/pw/medium/4108a99e0d1437151d9d08906836e07d.jpg" style="margin: 0; width: 100%;" alt="" />
<p style="font-size: 12px; margin: 0;">PikWizard</p>
</a>
</span>
</span>
Free (free of charge)
Free for personal and commercial use.
Author: Authentic Images
Similar Free Stock Images

Premium


Premium

Premium


Premium


Premium


Premium


Premium


Premium


Premium

Premium

Premium


Premium


Premium


Premium

Premium


Premium


Premium


Premium


Premium


Premium


Premium


Premium

Premium


Premium


Premium

Explore More Free Stock Images