
- Home >
- Free Stock Photos & Images >
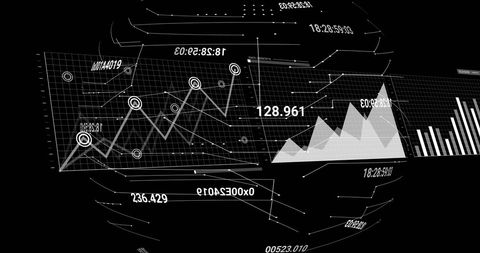
- 3D Wireframe Network Globe Pulsing Over Dark Virtual Dashboard for Data Visualization
3D Wireframe Network Globe Pulsing Over Dark Virtual Dashboard for Data Visualization Free Stock Image

Depicting 3D wireframe globe pulsing with glowing magenta nodes and connecting lines above dark virtual dashboard with grid, bar chart, and area chart overlays. Emphasizing network connectivity, social analytics, and data flow with icon markers such as heart, envelope, and thumbs up. Color palette featuring deep navy background, neon magenta highlights, and subtle white chart elements for high contrast. Use for tech presentations, pitch decks, corporate reports, website headers, social media campaigns, fintech and cybersecurity marketing. Place behind headlines, overlay with semi transparent panels for copy, or animate node motion for intro sequences and explainer videos. Suitable for print and digital applications including banner ads, infographics, slide decks, and product landing pages. Crop-friendly for wide or square formats; maintain contrast for legibility of overlay text and data labels. Ideal visual asset for communicating analytics, network performance, user engagement, and futuristic technology concepts.
Powered by  - Get 15% off with code: PIKWIZARD15


downloads
Tags:
More
Credit Photo
If you would like to credit the Photo, here are some ways you can do so
Text Link
photo Link
<span class="text-link">
<span>
<a target="_blank" href=https://pikwizard.com/photo/3d-wireframe-network-globe-pulsing-over-dark-virtual-dashboard-for-data-visualization/8b33cb85caa3b36caf8a15eacaf4d1f9/>PikWizard</a>
</span>
</span>
<span class="image-link">
<span
style="margin: 0 0 20px 0; display: inline-block; vertical-align: middle; width: 100%;"
>
<a
target="_blank"
href="https://pikwizard.com/photo/3d-wireframe-network-globe-pulsing-over-dark-virtual-dashboard-for-data-visualization/8b33cb85caa3b36caf8a15eacaf4d1f9/"
style="text-decoration: none; font-size: 10px; margin: 0;"
>
<img src="https://thumbs.wbm.im/pw/medium/8b33cb85caa3b36caf8a15eacaf4d1f9.jpg" style="margin: 0; width: 100%;" alt="3D Wireframe Network Globe Pulsing Over Dark Virtual Dashboard for Data Visualization" />
<p style="font-size: 12px; margin: 0;">PikWizard</p>
</a>
</span>
</span>
Free (free of charge)
Free for personal and commercial use.
Author: Authentic Images
Similar Free Stock Images


Premium


Premium


Premium


Premium


Premium


Premium


Premium


Premium


Premium


Premium


Premium


Premium


Premium


Premium


Premium


Premium


Premium


Premium


Premium


Premium


Premium


Premium


Premium


Premium


Premium

Explore More Free Stock Images