
- Home >
- Free Stock Photos & Images >
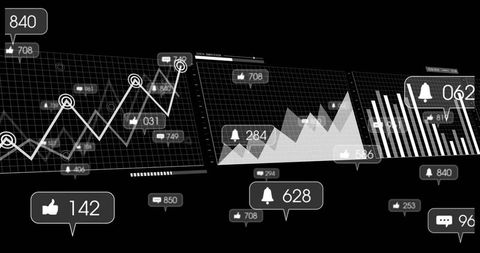
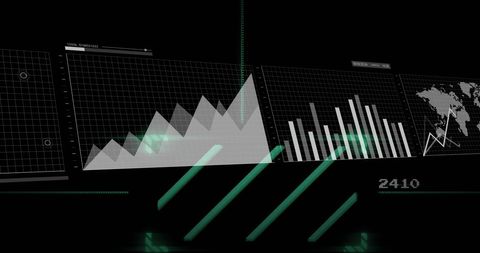
- Monochrome futuristic analytics dashboard with flowing binary stream and data visualization
Monochrome futuristic analytics dashboard with flowing binary stream and data visualization Free Stock Image
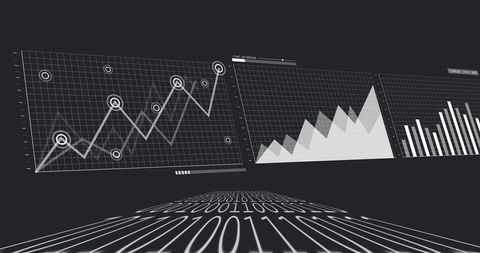
Featuring flowing binary stream curving toward three data panels with line markers, area peaks, bar charts and sliders. Monochrome futuristic look creating high-tech mood for fintech, AI, cybersecurity and data science projects. Ideal for hero backgrounds, presentation slides, website headers, marketing banners, report covers, editorial articles and training materials. Use for illustrating big data analytics, performance metrics, trend analysis, dashboard interface design and user interface concept visuals.
Powered by  - Get 15% off with code: PIKWIZARD15


downloads
Tags:
More
Credit Photo
If you would like to credit the Photo, here are some ways you can do so
Text Link
photo Link
<span class="text-link">
<span>
<a target="_blank" href=https://pikwizard.com/photo/monochrome-futuristic-analytics-dashboard-with-flowing-binary-stream-and-data-visualization/449f30e8cb64d3c30d02cb066fb7430f/>PikWizard</a>
</span>
</span>
<span class="image-link">
<span
style="margin: 0 0 20px 0; display: inline-block; vertical-align: middle; width: 100%;"
>
<a
target="_blank"
href="https://pikwizard.com/photo/monochrome-futuristic-analytics-dashboard-with-flowing-binary-stream-and-data-visualization/449f30e8cb64d3c30d02cb066fb7430f/"
style="text-decoration: none; font-size: 10px; margin: 0;"
>
<img src="https://thumbs.wbm.im/pw/medium/449f30e8cb64d3c30d02cb066fb7430f.jpg" style="margin: 0; width: 100%;" alt="Monochrome futuristic analytics dashboard with flowing binary stream and data visualization" />
<p style="font-size: 12px; margin: 0;">PikWizard</p>
</a>
</span>
</span>
Free (free of charge)
Free for personal and commercial use.
Author: Authentic Images
Similar Free Stock Images


Premium


Premium


Premium


Premium


Premium


Premium


Premium


Premium


Premium


Premium


Premium


Premium


Premium


Premium


Premium


Premium


Premium


Premium


Premium


Premium


Premium


Premium


Premium


Premium


Premium

Explore More Free Stock Images