- Home >
- Free Stock Photos & Images >
- Neon Data Visualization Dashboard with Binary Streams, Bar and Line Grid Charts
Neon Data Visualization Dashboard with Binary Streams, Bar and Line Grid Charts Free Stock Image

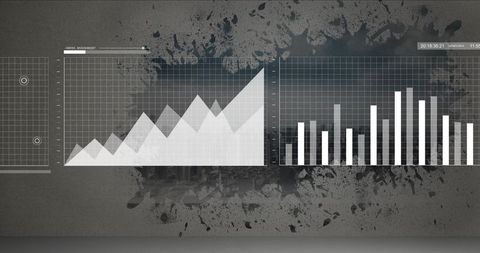
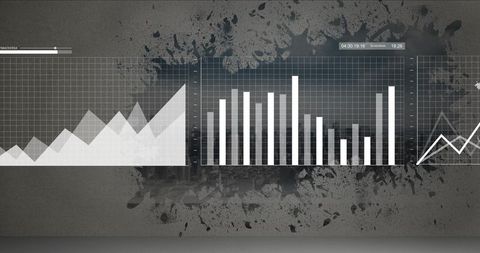
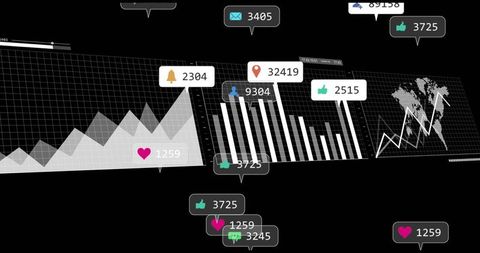
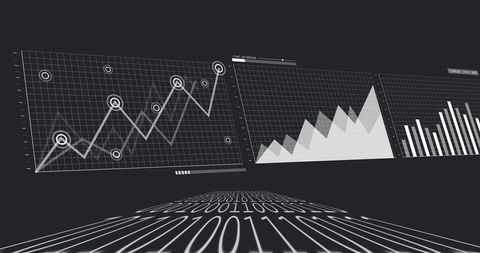
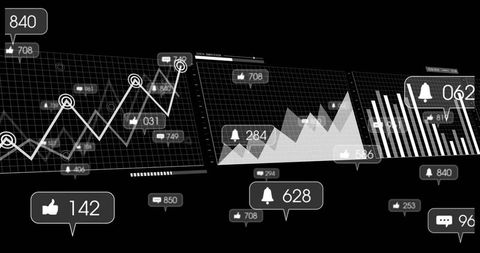
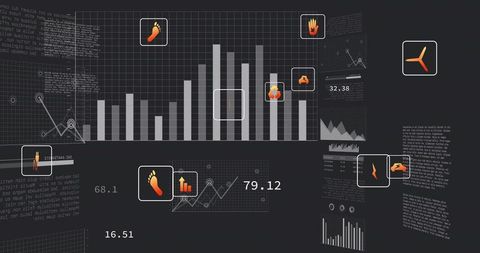
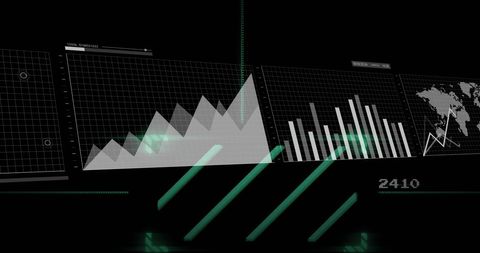
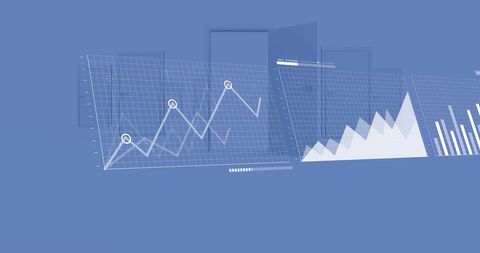
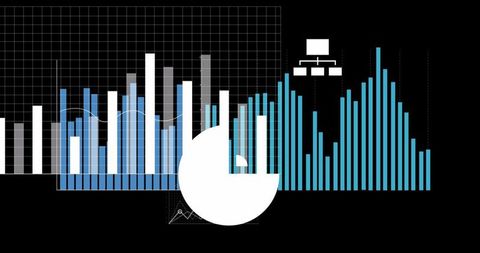
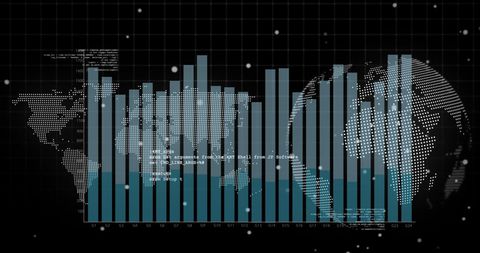
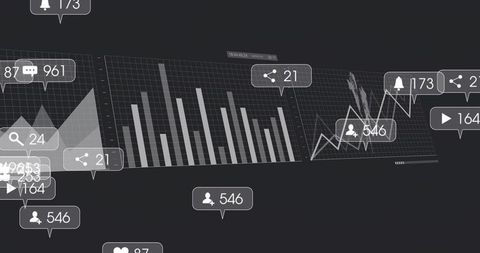
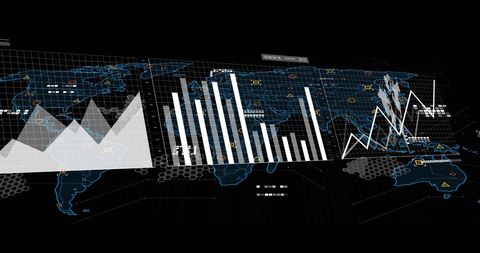
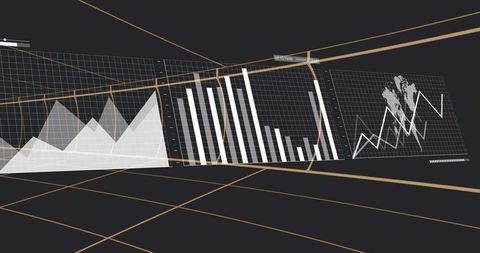
Showing neon grid panels displaying area, bar, and line charts over falling binary streams with world map overlay. Suiting fintech, data analytics, cybersecurity, AI research, and financial reporting projects. Working as hero header, slide background, presentation cover, infographic element, or web banner. Providing strong contrast, futuristic mood, and clear visual hierarchy for data-driven storytelling. Optimizing delivery across print and web, supporting marketing campaigns, corporate reports, investor decks, and app interface mockups.

downloads
Tags:
More
Credit Photo
If you would like to credit the Photo, here are some ways you can do so
Text Link
photo Link
<span class="text-link">
<span>
<a target="_blank" href=https://pikwizard.com/photo/neon-data-visualization-dashboard-with-binary-streams-bar-and-line-grid-charts/d0b11754682261e36ea45248f6a48acc/>PikWizard</a>
</span>
</span>
<span class="image-link">
<span
style="margin: 0 0 20px 0; display: inline-block; vertical-align: middle; width: 100%;"
>
<a
target="_blank"
href="https://pikwizard.com/photo/neon-data-visualization-dashboard-with-binary-streams-bar-and-line-grid-charts/d0b11754682261e36ea45248f6a48acc/"
style="text-decoration: none; font-size: 10px; margin: 0;"
>
<img src="https://thumbs.wbm.im/pw/medium/d0b11754682261e36ea45248f6a48acc.jpg" style="margin: 0; width: 100%;" alt="Neon Data Visualization Dashboard with Binary Streams, Bar and Line Grid Charts" />
<p style="font-size: 12px; margin: 0;">PikWizard</p>
</a>
</span>
</span>
Free (free of charge)
Free for personal and commercial use.
Author: Authentic Images