
- Home >
- Stock Photos >
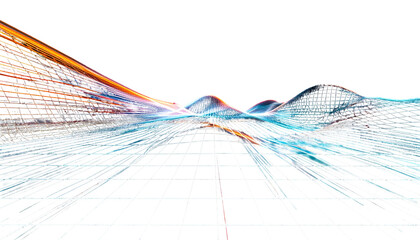
- Abstract Blue Light Trails with Data Processing Overlay
Abstract Blue Light Trails with Data Processing Overlay Image

Image shows dynamic interplay of blue light trails with overlaid financial data graphics, showcasing digital and analytical themes. Ideal for technology, finance, and data analysis related content, visual storytelling in presentations or as a background in apps focusing on stock market, investments, and financial predictions. Attractive to viewers interested in cutting-edge technology and real-time information display.
Powered by 


downloads
Tags:
More
Credit Photo
If you would like to credit the Photo, here are some ways you can do so
Text Link
photo Link
<span class="text-link">
<span>
<a target="_blank" href=https://pikwizard.com/photo/abstract-blue-light-trails-with-data-processing-overlay/33610d43448d0565c08b64a861ccf110/>PikWizard</a>
</span>
</span>
<span class="image-link">
<span
style="margin: 0 0 20px 0; display: inline-block; vertical-align: middle; width: 100%;"
>
<a
target="_blank"
href="https://pikwizard.com/photo/abstract-blue-light-trails-with-data-processing-overlay/33610d43448d0565c08b64a861ccf110/"
style="text-decoration: none; font-size: 10px; margin: 0;"
>
<img src="https://pikwizard.com/pw/medium/33610d43448d0565c08b64a861ccf110.jpg" style="margin: 0; width: 100%;" alt="" />
<p style="font-size: 12px; margin: 0;">PikWizard</p>
</a>
</span>
</span>
Free (free of charge)
Free for personal and commercial use.
Author: Creative Art
Similar Free Stock Images

Premium


Premium


Premium
Premium


Premium


Premium


Premium


Premium

Premium

Premium


Premium


Premium


Premium


Premium


Premium


Premium


Premium

Premium


Premium

Premium


Premium


Premium


Premium


Premium


Premium

Explore More Free Stock Images