- Home >
- Stock Photos >
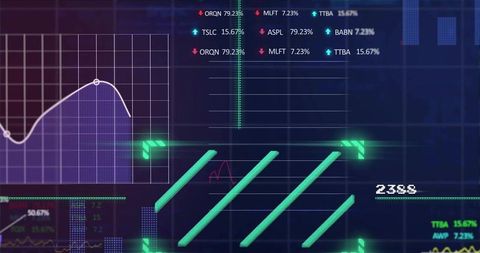
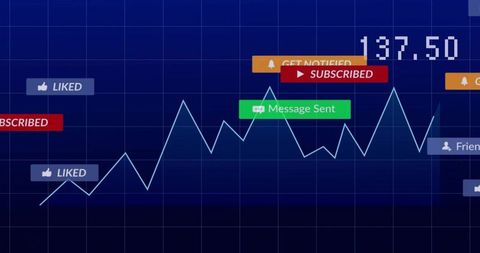
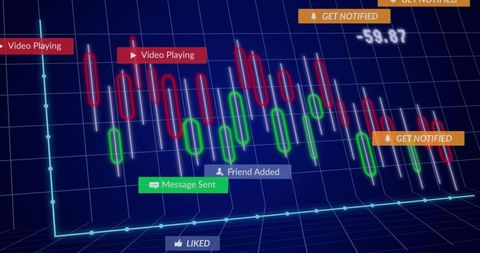
- Abstract Financial Data Visualization with Holographic Elements
Abstract Financial Data Visualization with Holographic Elements Image

This visualization showcases an abstract representation of financial data with a mix of colorful holographic elements layered over graphs. Ideal for expressing concepts related to stock markets, fintech innovation, or advanced analytics. Useful for marketing materials, educational content, or digital interface design illustrating modern finance and technology integration.

downloads
Tags:
More
Credit Photo
If you would like to credit the Photo, here are some ways you can do so
Text Link
photo Link
<span class="text-link">
<span>
<a target="_blank" href=https://pikwizard.com/photo/abstract-financial-data-visualization-with-holographic-elements/4df5135edd8a1e2eb689dc59257217f7/>PikWizard</a>
</span>
</span>
<span class="image-link">
<span
style="margin: 0 0 20px 0; display: inline-block; vertical-align: middle; width: 100%;"
>
<a
target="_blank"
href="https://pikwizard.com/photo/abstract-financial-data-visualization-with-holographic-elements/4df5135edd8a1e2eb689dc59257217f7/"
style="text-decoration: none; font-size: 10px; margin: 0;"
>
<img src="https://pikwizard.com/pw/medium/4df5135edd8a1e2eb689dc59257217f7.jpg" style="margin: 0; width: 100%;" alt="" />
<p style="font-size: 12px; margin: 0;">PikWizard</p>
</a>
</span>
</span>
Free (free of charge)
Free for personal and commercial use.
Author: People Creations