- Home >
- Stock Photos >
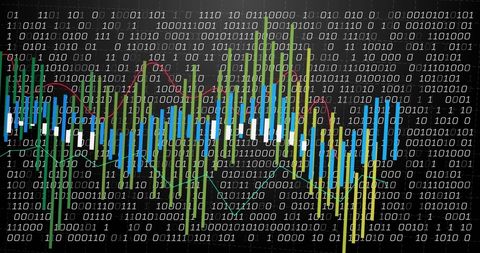
- Binary Code with Colorful Bar Graph for Data Analysis
Binary Code with Colorful Bar Graph for Data Analysis Image

Featuring binary code intertwined with a colorful bar graph, this image emphasizes concepts of data analysis and technology. It represents statistics and information visualization, making it ideal for use in presentations about analytics, education on computing, or illustrating concepts in reports related to information technology.

downloads
Tags:
More
Credit Photo
If you would like to credit the Photo, here are some ways you can do so
Text Link
photo Link
<span class="text-link">
<span>
<a target="_blank" href=https://pikwizard.com/photo/binary-code-with-colorful-bar-graph-for-data-analysis/e5702a17292821e25ff6b004927e4d4f/>PikWizard</a>
</span>
</span>
<span class="image-link">
<span
style="margin: 0 0 20px 0; display: inline-block; vertical-align: middle; width: 100%;"
>
<a
target="_blank"
href="https://pikwizard.com/photo/binary-code-with-colorful-bar-graph-for-data-analysis/e5702a17292821e25ff6b004927e4d4f/"
style="text-decoration: none; font-size: 10px; margin: 0;"
>
<img src="https://pikwizard.com/pw/medium/e5702a17292821e25ff6b004927e4d4f.jpg" style="margin: 0; width: 100%;" alt="" />
<p style="font-size: 12px; margin: 0;">PikWizard</p>
</a>
</span>
</span>
Free (free of charge)
Free for personal and commercial use.
Author: People Creations