
- Home >
- Stock Photos >
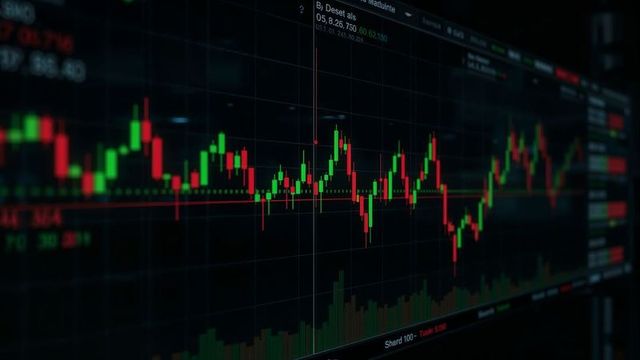
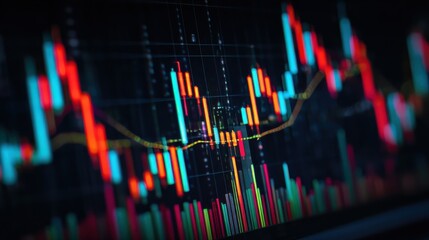
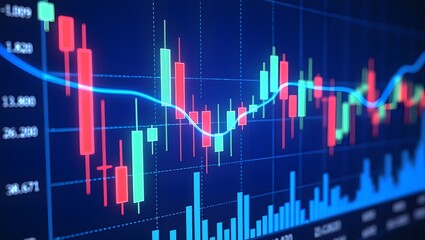
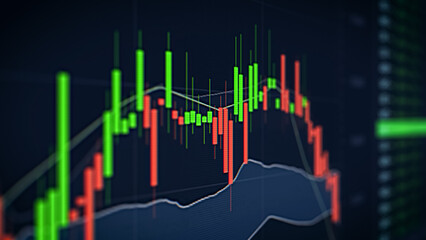
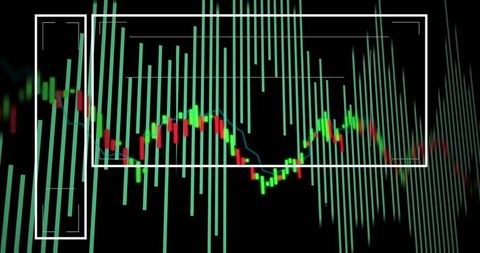
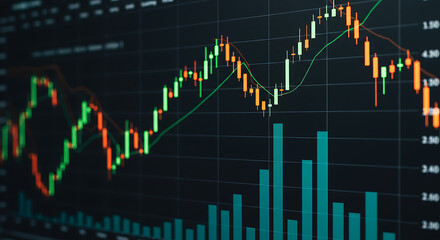
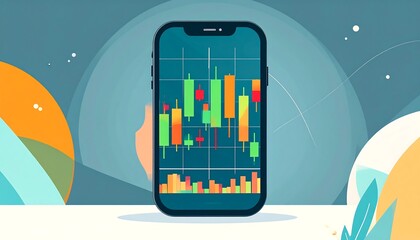
- Digital Candlestick Chart on Trading Platform Screen
Digital Candlestick Chart on Trading Platform Screen Image
AI
AI Generated Image. Displaying candlestick chart on computer monitor for analyzing trading data on a digital platform. Suitable for finance articles, investment blogs, and technology presentations highlighting stock market trends and technological advancements in data analytics tools.
Powered by 


downloads
Tags:
More
Credit Photo
If you would like to credit the Photo, here are some ways you can do so
Text Link
photo Link
<span class="text-link">
<span>
<a target="_blank" href=https://pikwizard.com/photo/digital-candlestick-chart-on-trading-platform-screen/8738e2823eeb84cf87acb49285aedf38/>PikWizard</a>
</span>
</span>
<span class="image-link">
<span
style="margin: 0 0 20px 0; display: inline-block; vertical-align: middle; width: 100%;"
>
<a
target="_blank"
href="https://pikwizard.com/photo/digital-candlestick-chart-on-trading-platform-screen/8738e2823eeb84cf87acb49285aedf38/"
style="text-decoration: none; font-size: 10px; margin: 0;"
>
<img src="https://pikwizard.com/pw/medium/8738e2823eeb84cf87acb49285aedf38.jpg" style="margin: 0; width: 100%;" alt="" />
<p style="font-size: 12px; margin: 0;">PikWizard</p>
</a>
</span>
</span>
Free (free of charge)
Free for personal and commercial use.
Author: AI Creator
Similar Free Stock Images

Premium


Premium


Premium
Premium


AI


Premium


Premium


AI


Premium
Premium


Premium


Premium

Premium


Premium


Premium


Premium
Premium


Premium
Premium


AI
AI


Premium
Premium


Premium

AI


Premium


Premium


Premium


Premium


Premium

Explore More Free Stock Images