
- Home >
- Stock Photos >
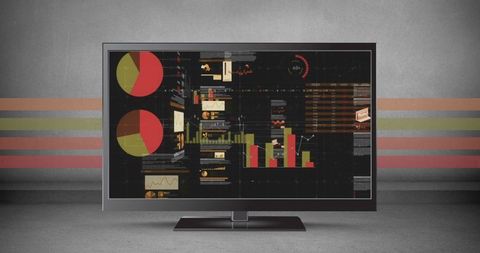
- Digital Dashboard with Analytical Data Display
Digital Dashboard with Analytical Data Display Image

Digital dashboard displays various data visualizations and analytical graphs on gray background. Useful for illustrating concepts in data analysis, business intelligence, and digital interfaces for professional presentations or online articles regarding technology and global data trends.
Powered by 


downloads
Tags:
More
Credit Photo
If you would like to credit the Photo, here are some ways you can do so
Text Link
photo Link
<span class="text-link">
<span>
<a target="_blank" href=https://pikwizard.com/photo/digital-dashboard-with-analytical-data-display/5eb39e45dac3e847675484e40a8a9df1/>PikWizard</a>
</span>
</span>
<span class="image-link">
<span
style="margin: 0 0 20px 0; display: inline-block; vertical-align: middle; width: 100%;"
>
<a
target="_blank"
href="https://pikwizard.com/photo/digital-dashboard-with-analytical-data-display/5eb39e45dac3e847675484e40a8a9df1/"
style="text-decoration: none; font-size: 10px; margin: 0;"
>
<img src="https://pikwizard.com/pw/medium/5eb39e45dac3e847675484e40a8a9df1.jpg" style="margin: 0; width: 100%;" alt="" />
<p style="font-size: 12px; margin: 0;">PikWizard</p>
</a>
</span>
</span>
Free (free of charge)
Free for personal and commercial use.
Author: Creative Art
Similar Free Stock Images

Premium


Premium

Premium

AI


Premium

Premium


Premium


Premium


AI


Premium


Premium


AI


Premium


AI


Premium


AI

Premium


Premium

Premium


Premium


Premium


AI


Premium


AI

Premium


AI


Premium


Premium


AI


Premium


AI


AI

AI


Premium

AI


AI

Premium

Premium

AI


Premium


Explore More Free Stock Images