1. Home > 
  2. Stock Photos > 
  3. Digital Data Processing and Analysis on Dark Interface

Digital Data Processing and Analysis on Dark Interface Image

Digital Data Processing and Analysis on Dark Interface

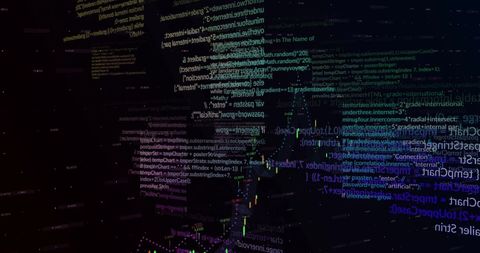
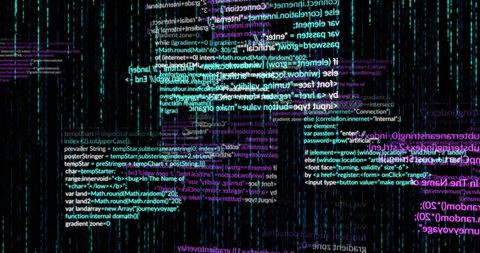
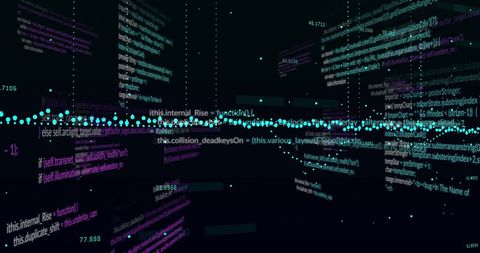
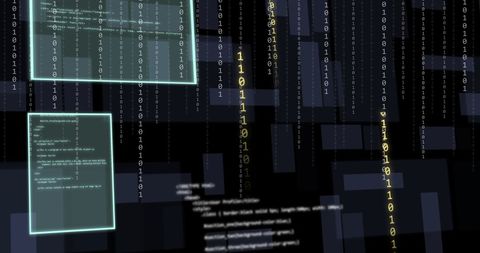
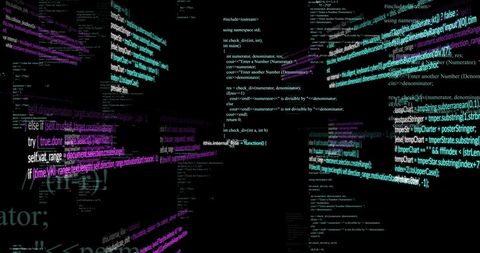
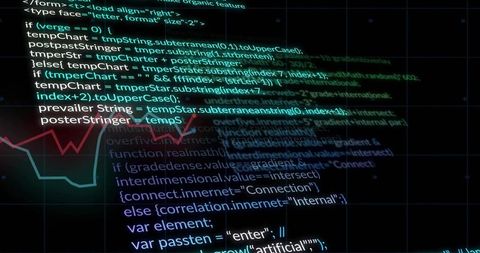
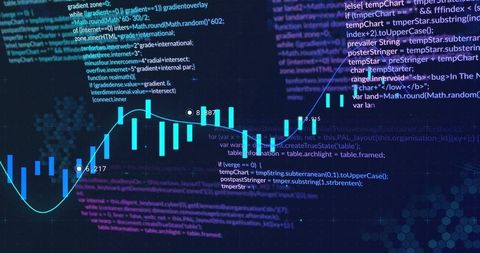
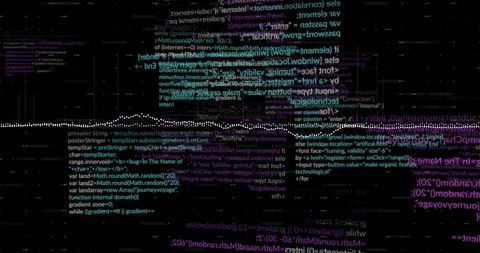
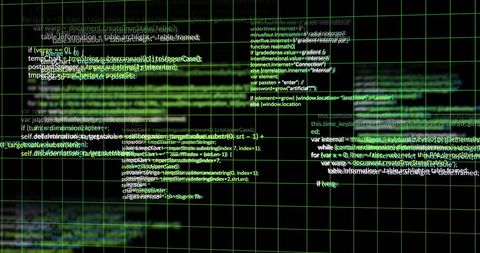
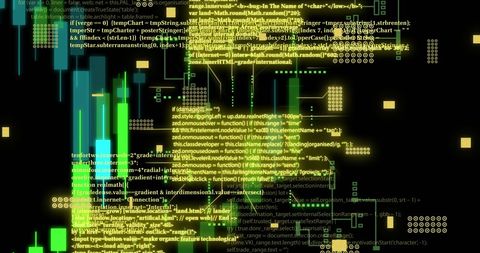
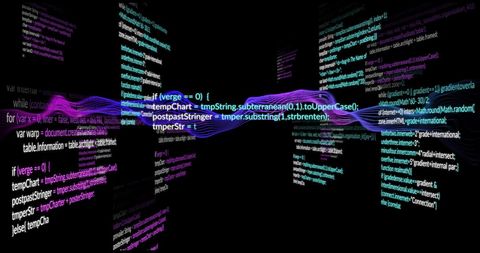
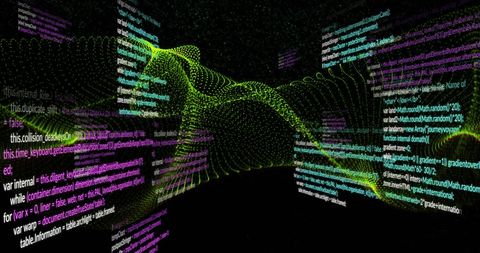
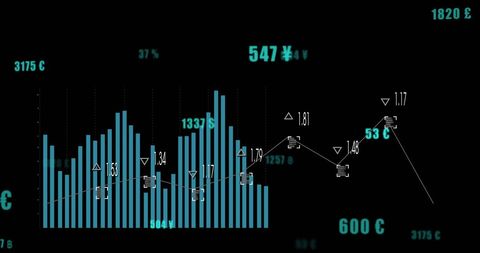
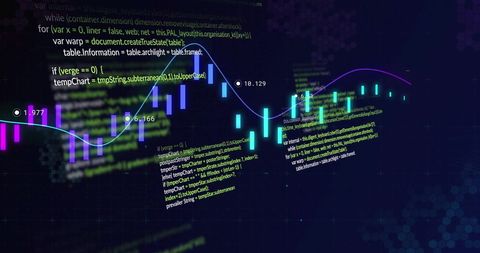
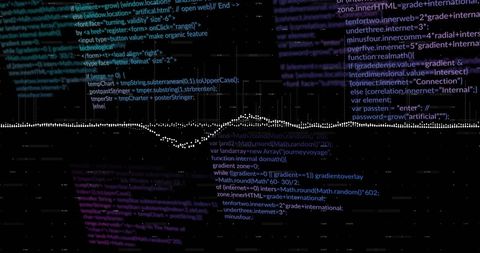
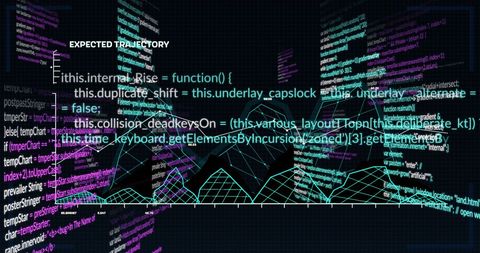
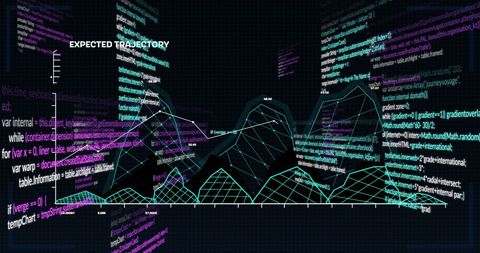
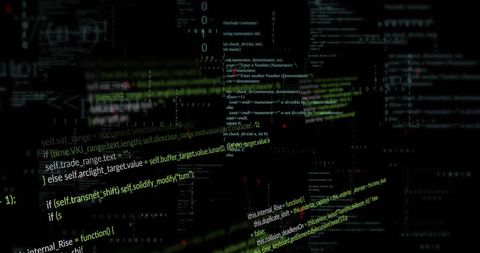
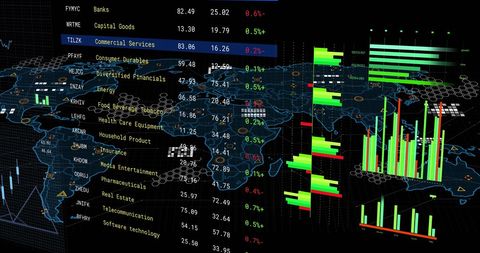
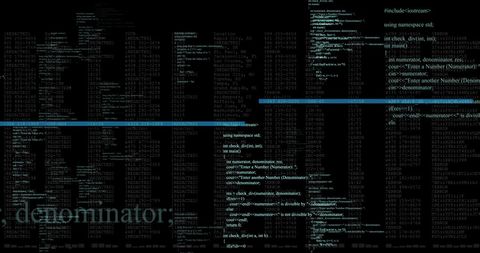
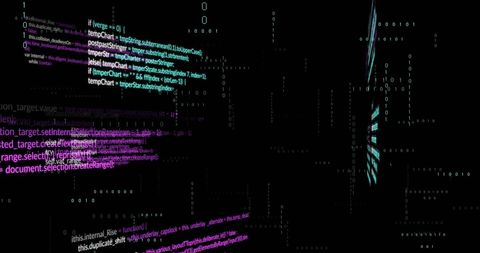
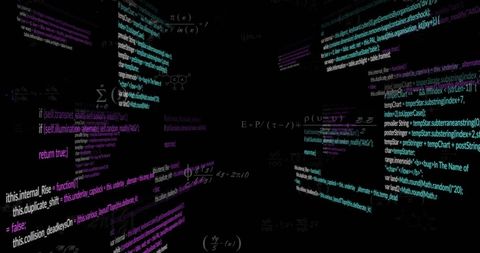
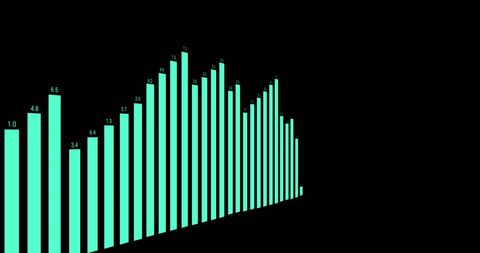
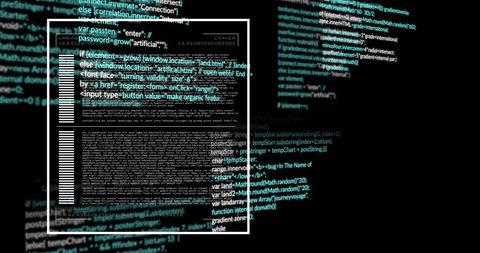
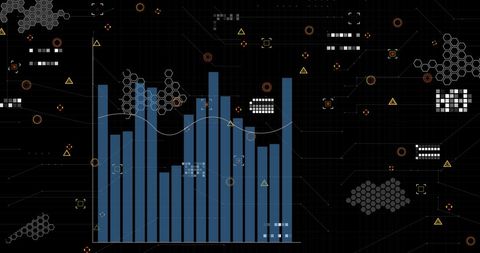
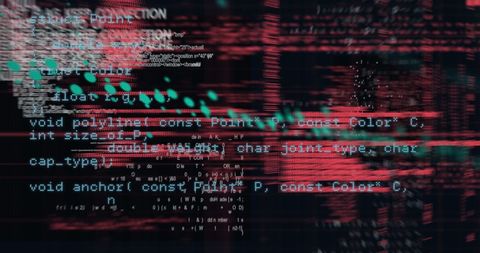
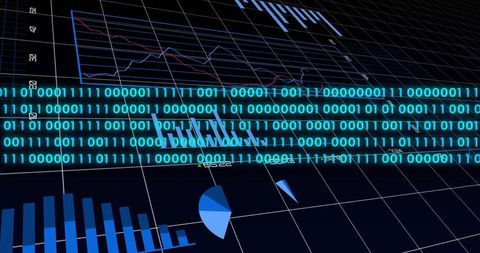
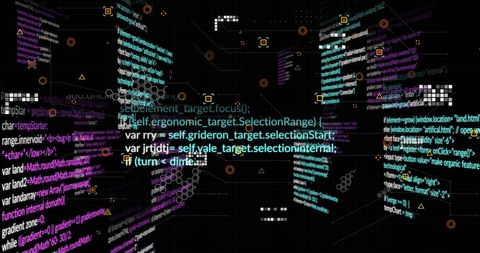
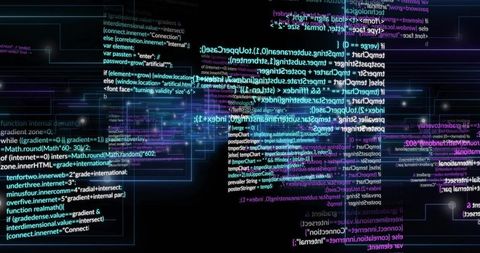
This vibrant depiction of digital data processing against a dark backdrop offers a dynamic visualization of programming in action. The image includes textual code and bar graphics, suggesting a focus on stats and analytics. Suitable for illustrating concepts in software development, programming tutorials, digital marketing presentations, and networking strategy articles.

Powered by Adobe logo
A close-up view of hands typing on a keyboard with cloud computing icons and data graphs overlaid, representing digital technology and modern information management concepts. Xenic - Powered by AdobeFuturistic digital interface overlaying a cityscape, showcasing data visualization and global connections. - Powered by AdobeDigital Insights: A person interacts with a futuristic digital interface, manipulating data that glows, representing the power of modern technology in finance. - Powered by AdobeA person holding glasses with data reflecting on the lenses - Powered by AdobeFinancial Data at Your Fingertips: Immerse yourself in the sleek lines and intricate details of a financial dashboard, charting the rise and fall of markets, presenting the complex world of finance. - Powered by Adobe

Credit Photo

If you would like to credit the Photo, here are some ways you can do so

Free (free of charge)

Free for personal and commercial use.

Author: People Creations

Similar Free Stock Images

Dynamic Stock Market Ticker Against Code Background
Premium
Businessman holding magnifying glass over digital checkboxes and analytics documents representing data verification and whitelist concept on dark background.
Digital Data Analysis with Rising Arrows on Black Background
Complex Data Processing Interface with Digital Code Overlay
Futuristic Code Wall with Digital Lines Insight
Dynamic Data Visualization Depicting Financial Growth Trends
Premium
AI payroll system interface showing employee salary data, budgeting graphs, and monthly calendar used on laptop for digital finance management and automated compensation planning in business setup
Abstract Financial Data Analysis Conceptual Design
Dynamic Financial Graphs and Data in Digital Abstract
Global Financial Data Analytics with World Map and Graphs
Innovative Data Visualizations with Graphs and Charts
Premium
Digital data analysis displaying financial market trends
Dynamic Bars Overlapping Graph in Financial Analysis
Digital Code Flow with Colorful Data Streams
Binary Code Financial Data Visualization
Global Data Processing and Analytics on Dark Background
Premium
Tech-style interface with crypto dashboards and neural AI processing data
Futuristic Data Analysis with Cityscape Background
Colorful Graphical Data Analysis in Abstract Background
Dynamic Financial Data Overlaid on Digital Grid
Cyber Code on Dark Grid Matrix Background
Premium
Man analyzes data with holographic interfaces on his laptop representing business intelligence for data driven decisions, insights and strategy.
Dynamic Data Visualization in Abstract Digital Interface
Digital Projection of Financial Data with Bar Graphs
Abstract Data Visualization with Neon Waveforms
Digital Financial Data Display with Glowing Green Text
Premium
Futuristic digital eye interface displaying holographic data charts and abstract geometric shapes.
Dynamic Data Visualization with Binary Matrix
Futuristic Trading Dashboard with Neon Graphs and Data Visualization
Digital Dashboard with Computer Code and Financial Graphs
Futuristic Energy Analytics Interface with Sustainability Icons
Abstract Financial Data and Graph Analysis on Digital Screen
Global Financial Data Processing Illustration on Yellow
Premium
Artificial Intelligence concept with data analytics dashboard, command prompt and digital brain interface, representing AI generation, machine learning, big data processing and automation tools.
Data Processing Visual with Graphs and Code Over Black Background
Futuristic Data Processing with Code and Technology Elements
Data Processing and Analytics Over Cityscape at Night
Financial Chart Analysis and Data Visualization Concept
Premium
Digital display showing vibrant blue, pink, and purple graphs and data visualizations
Financial Data Analysis with Abstract Graphics
Digital Data Visualization with 3D Bar Graph
Colorful Data Analytics and Statistics Conceptual Graphics
Abstract Financial Data Visualization with Analytics
Premium
A dynamic digital representation of data trends with vibrant red and blue lines, symbolizing market fluctuations or technological advancements.
Financial Data Display with Urban Reflections Overlay
Financial Data Analysis with Code Interface on Black Background
Dynamic Financial Data Analytics Display with Graphs
Digital Data Interface with Graphs for Business Analysis
Premium
Young Asian man interacts with a futuristic holographic interface featuring the AI logo and data visuals. He appears to be working with Artificial Intelligence technology.
Financial Data Flowing Over Technological Circuit Visualization
Digital Data Processing Over Neural Network Mesh
Digital Data Processing with Global Connections and Code
Digital Data Processing with Glowing Code Visuals
Premium
Digital data processing with hud interface elements
Digital Data Processing and Analysis Visualizations
Digital Coding and Financial Stock Market Graph Analysis
Futuristic Data Visualization Graph and Interface Elements
Digital Data Analysis Over World Map with Graphs and Codes
Premium
Businessman's hand touching a glowing virtual bar chart displaying increasing financial data and various business process icons, representing progress and digital transformation
Dynamic Financial Market Chart Display with Candlesticks
Digital Stock Chart with Abstract Network in Pink Hues
Streaming Neon Code Panels Crossing Cyber Grid, Holographic Network Motion Background
Data Analytics and Statistics Display Over Digital Interface
Financial Data Processing on Digital Screen with Global Currencies
Abstract Digital Data Visualization
Premium
Financial Data Display: An abstract view of financial data, with complex charts and illuminated panels, suggesting intricate processing and digital information.
Dynamic Data Processing Abstract Concept
Abstract Data Processing and Analytics Concept
Digital Display of Financial Data Analytics and Graphs
Colorful Financial Data Visualization with Statistical Graphs
Premium
Engineer inspecting futuristic data display in modern factory
3D Blue Bar Graph on Black Background Visualizing Data Trends
Digital Financial Charts and Graphs on Navy Background
Dynamic Financial Data Analysis With Abstract Global Background
Social Media Interaction Graph on Digital Network
Premium
A futuristic robot examines data on multiple screens in a factory setting, its robotic arm interacting with the displays
Global Finance Analysis with Digital Interface Overlay
Dynamic Graphs on Black Background for Financial Technology Concepts
Digital Financial Analysis with Real-Time Stock Market Data
Futuristic Data Visualization and Analysis Display
Premium
A person uses a tablet to interact with a digital dashboard displaying activity metrics and graphs. Ideal for showcasing technology and performance analytics. Impute
Digital Data Processing and Coding Interface Over Black
Digital Finance Data and Statistical Graphs on Dark Background
Digital Data Processing Interfaces on Dark Background
Digital Interface with Data Streams and Stock Market Elements
Premium
Dynamic Data: A captivating digital display showcases the power of information, filled with intricate charts and graphs that visualize complex data, against a striking backdrop of illuminated grids.
Dynamic Data Processing with Digital Interface
Futuristic Financial Data Analysis and Coding Visualization
Digital Data Processing Overlay with Graphs and Charts
Futuristic Finance Interface and Software Analytics Visualization
Premium
Futuristic holographic interface displaying data analytics, charts, and icons on a digital screen.
Highlighted Code Overlapping Line Graphs in Virtual Environment
Encrypted waveform visualizing secure network traffic on futuristic digital dashboard UI
Global Financial Data Analysis with Currency Graphs
Global Financial Market Trends with Currency Exchange Rates
Digital Code Display on Black Background Illustration
Data Processing Visual with Technical Elements
Premium
Analyzing data insights with touchscreen technology modern office digital content high-tech environment close-up viewpoint interactive visualization
Abstract Chart and Graphs Illustrating Digital Data Analysis
Financial Data Analysis with Charts and Graphs
Dynamic Financial Data Analysis with Interactive Charts and Graphs
Global Financial Data Visual Representation with World Map Overlay
Premium
Person using a laptop with a futuristic holographic interface displaying data and workflow diagrams.
Global Financial Data Visualization on Digital Map
Dynamic Financial Data Analysis on Digital Platform
Digital Financial Data Analysis on Global Map
Financial Data Processing with Digital Interface Graphics
Premium
Futuristic 3D pie chart made of glowing wireframe mesh. Concept of market data segmentation and financial allocation analysis.
Financial Data Analytics with Abstract Graphs and Currency Symbols
Abstract Digital Visualization with Coding Hologram Projection
Futuristic Digital Data Analysis Interface on Black Background
Stock Market Graphs Displaying Financial Analytics
Premium
Digital data processing on global network interface system
Data Processing with Digital Interface and Code Background
Digital Data Streams and Code on Black Background
Binary Code with Colorful Bar Graph for Data Analysis
Coding and Mathematical Equations on Black Background
Premium
Woman in glasses looking at futuristic digital interface with charts and data image
Binary Code Flowchart Background with Digital Animation
Digital Faces Among Stock Market Data Lines
Futuristic Digital Interface with Data Visualization and C++ Code
Cybersecurity with Candlestick Chart and Digital Interface
Premium
Engineer analyzing big data and digital analytics on tablet with futuristic interface overlay representing data science, AI, cloud computing, IoT, smart industry, and digital transformation.
Neon Code Columns Overlaid on Global Network Map Visualizing Cyber Data Flow and Analytics