
- Home >
- Stock Photos >
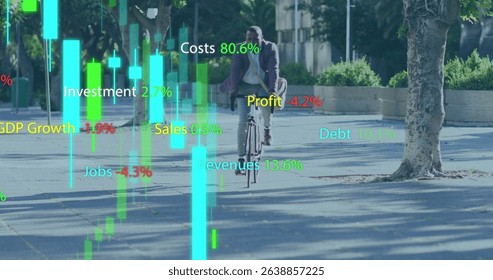
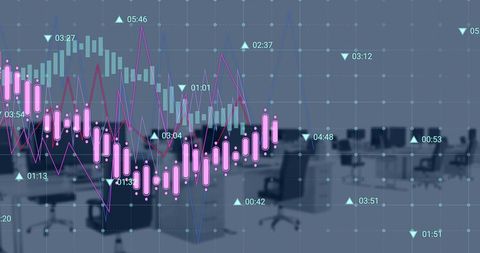
- Digital Data Processing Overlap with Financial Interfaces
Digital Data Processing Overlap with Financial Interfaces Image

Displays a concept of data integration and financial analysis. Suitable for technology blogs, stock market articles, presentations on business strategies and future financial trends comprehension.
Powered by  - Get 15% off with code: PIKWIZARD15


downloads
Tags:
More
Credit Photo
If you would like to credit the Photo, here are some ways you can do so
Text Link
photo Link
<span class="text-link">
<span>
<a target="_blank" href=https://pikwizard.com/photo/digital-data-processing-overlap-with-financial-interfaces/b4e0c6df23dd7c7c0fb8232039adfb35/>PikWizard</a>
</span>
</span>
<span class="image-link">
<span
style="margin: 0 0 20px 0; display: inline-block; vertical-align: middle; width: 100%;"
>
<a
target="_blank"
href="https://pikwizard.com/photo/digital-data-processing-overlap-with-financial-interfaces/b4e0c6df23dd7c7c0fb8232039adfb35/"
style="text-decoration: none; font-size: 10px; margin: 0;"
>
<img src="https://pikwizard.com/pw/medium/b4e0c6df23dd7c7c0fb8232039adfb35.jpg" style="margin: 0; width: 100%;" alt="" />
<p style="font-size: 12px; margin: 0;">PikWizard</p>
</a>
</span>
</span>
Free (free of charge)
Free for personal and commercial use.
Author: Authentic Images
Similar Free Stock Images

Premium


Premium


Premium


Premium


Premium


Premium

Premium


Premium


Premium


Premium

Premium

Premium


Premium


Premium


Premium


Premium


Premium


Premium

Premium


Premium


Premium


Premium


Premium


Premium


Premium

Explore More Free Stock Images