
- Home >
- Stock Photos >
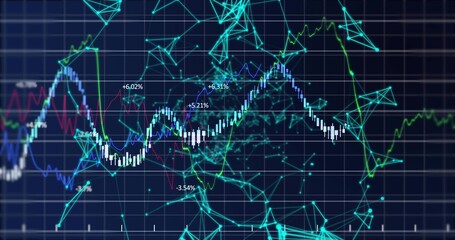
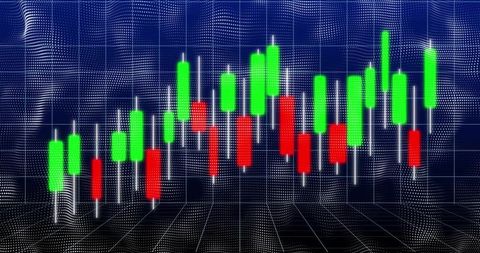
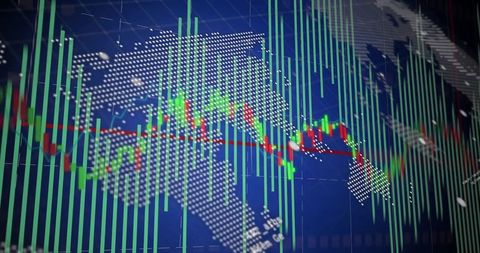
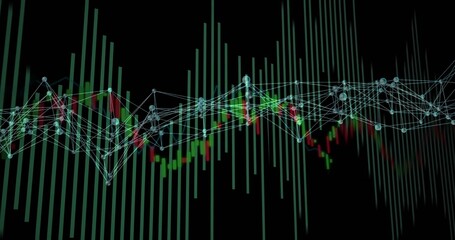
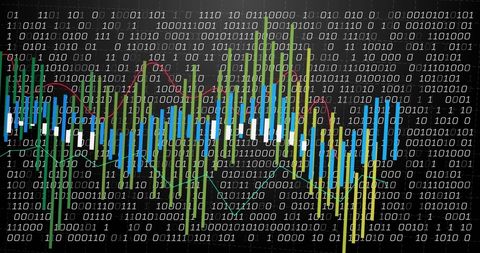
- Digital Data Visualization with Network Nodes and Candlestick Charts
Digital Data Visualization with Network Nodes and Candlestick Charts Image
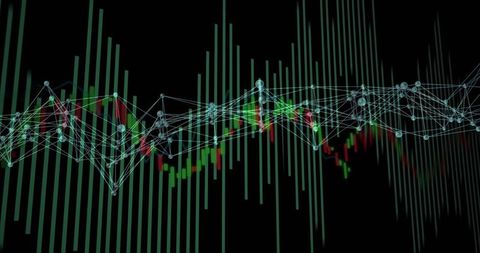
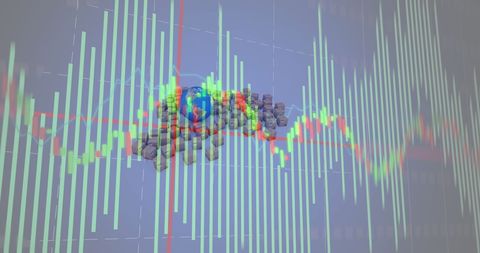
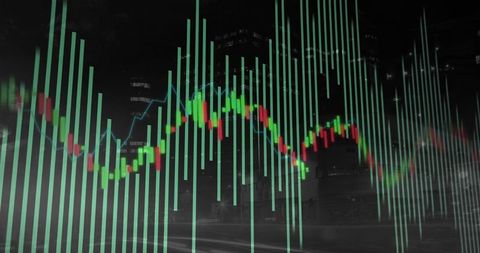
Abstract depiction combines network nodes with candlestick charts highlighting digital connectivity in financial analyses or blockchain technologies. Useful for presentations about stock market insights, blockchain developments, or data-centric industries. Suited for illustrating concepts in cutting-edge financial sectors or technological fields focused on analytics and market trends.
Powered by 


downloads
Tags:
More
Credit Photo
If you would like to credit the Photo, here are some ways you can do so
Text Link
photo Link
<span class="text-link">
<span>
<a target="_blank" href=https://pikwizard.com/photo/digital-data-visualization-with-network-nodes-and-candlestick-charts/4514dc9edeb6d763b710f2064b95a233/>PikWizard</a>
</span>
</span>
<span class="image-link">
<span
style="margin: 0 0 20px 0; display: inline-block; vertical-align: middle; width: 100%;"
>
<a
target="_blank"
href="https://pikwizard.com/photo/digital-data-visualization-with-network-nodes-and-candlestick-charts/4514dc9edeb6d763b710f2064b95a233/"
style="text-decoration: none; font-size: 10px; margin: 0;"
>
<img src="https://pikwizard.com/pw/medium/4514dc9edeb6d763b710f2064b95a233.jpg" style="margin: 0; width: 100%;" alt="" />
<p style="font-size: 12px; margin: 0;">PikWizard</p>
</a>
</span>
</span>
Free (free of charge)
Free for personal and commercial use.
Author: Awesome Content
Similar Free Stock Images
Premium


Premium


Premium


Premium


Premium


Premium


Premium


Premium


Premium


Premium


Premium

Premium

Premium


Premium


Premium

Premium

Premium


Premium


Premium


Premium


Premium


Premium


Premium


Premium


Premium

Explore More Free Stock Images