- Home >
- Stock Photos >
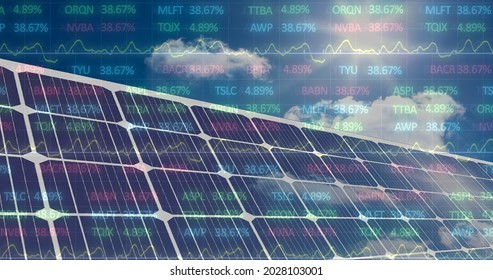
- Digital Financial Data Overlay on Solar Energy Concept
Digital Financial Data Overlay on Solar Energy Concept Image

Solar panel backdrop overlaid with colorful financial data and market performance indicators conveys the intersection of sustainable energy sectors with economic data analytics. Useful in articles or presentations discussing renewable energy investments, data-driven financial models in green technology, or economic forecasting within the solar energy industry.
Powered by  - Get 15% off with code: PIKWIZARD15


2
downloads
downloads
Tags:
More
Credit Photo
If you would like to credit the Photo, here are some ways you can do so
Text Link
photo Link
<span class="text-link">
<span>
<a target="_blank" href=https://pikwizard.com/photo/digital-financial-data-overlay-on-solar-energy-concept/cf8e2668d48a42280c263981ac7e8544/>PikWizard</a>
</span>
</span>
<span class="image-link">
<span
style="margin: 0 0 20px 0; display: inline-block; vertical-align: middle; width: 100%;"
>
<a
target="_blank"
href="https://pikwizard.com/photo/digital-financial-data-overlay-on-solar-energy-concept/cf8e2668d48a42280c263981ac7e8544/"
style="text-decoration: none; font-size: 10px; margin: 0;"
>
<img src="https://pikwizard.com/pw/medium/cf8e2668d48a42280c263981ac7e8544.jpg" style="margin: 0; width: 100%;" alt="" />
<p style="font-size: 12px; margin: 0;">PikWizard</p>
</a>
</span>
</span>
Free (free of charge)
Free for personal and commercial use.
Author: Creative Art
Similar Free Stock Images
Loading...

Premium


Premium


Premium

Premium


Premium


Premium


Premium

Premium

Premium

Premium


Premium

Premium


Premium


Premium


Premium


Premium


Premium


Premium


Premium


Premium


Premium

Premium

Premium

Premium


Premium