
- Home >
- Stock Photos >
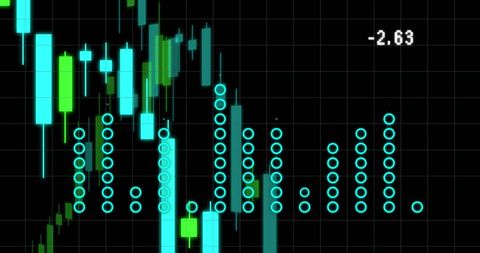
- Digital Financial Data Processing with Abstract Graph
Digital Financial Data Processing with Abstract Graph Image

Visual represents financial data and business analytics with an abstract digital graph on a dark background, symbolizing technology-driven business and finance environments. Ideal for illustrating concepts related to data-driven decision making, stock markets, data analysis, and modern financial technologies.
Powered by  - Get 15% off with code: PIKWIZARD15


downloads
Tags:
More
Credit Photo
If you would like to credit the Photo, here are some ways you can do so
Text Link
photo Link
<span class="text-link">
<span>
<a target="_blank" href=https://pikwizard.com/photo/digital-financial-data-processing-with-abstract-graph/5fbacb3cfcbd769f24aa93c5ce888a1f/>PikWizard</a>
</span>
</span>
<span class="image-link">
<span
style="margin: 0 0 20px 0; display: inline-block; vertical-align: middle; width: 100%;"
>
<a
target="_blank"
href="https://pikwizard.com/photo/digital-financial-data-processing-with-abstract-graph/5fbacb3cfcbd769f24aa93c5ce888a1f/"
style="text-decoration: none; font-size: 10px; margin: 0;"
>
<img src="https://pikwizard.com/pw/medium/5fbacb3cfcbd769f24aa93c5ce888a1f.jpg" style="margin: 0; width: 100%;" alt="" />
<p style="font-size: 12px; margin: 0;">PikWizard</p>
</a>
</span>
</span>
Free (free of charge)
Free for personal and commercial use.
Author: Awesome Content
Similar Free Stock Images

Premium


Premium

Premium


Premium


Premium


Premium


Premium


Premium

Premium

Premium

Premium


Premium


Premium


Premium


Premium


Premium


Premium


Premium


Premium


Premium


Premium

Premium


Premium


Premium


Premium


Explore More Free Stock Images