- Home >
- Stock Photos >
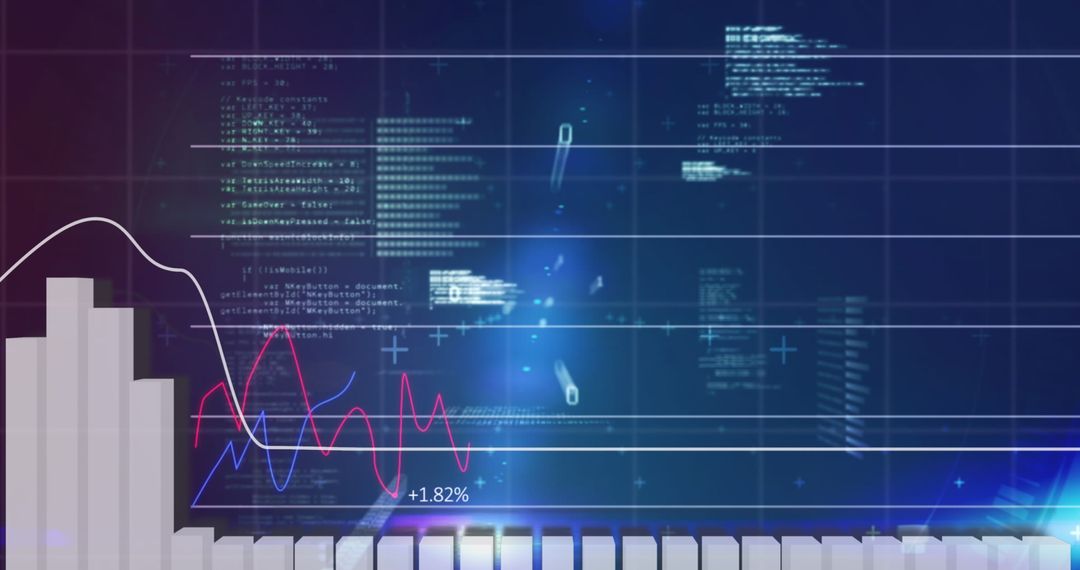
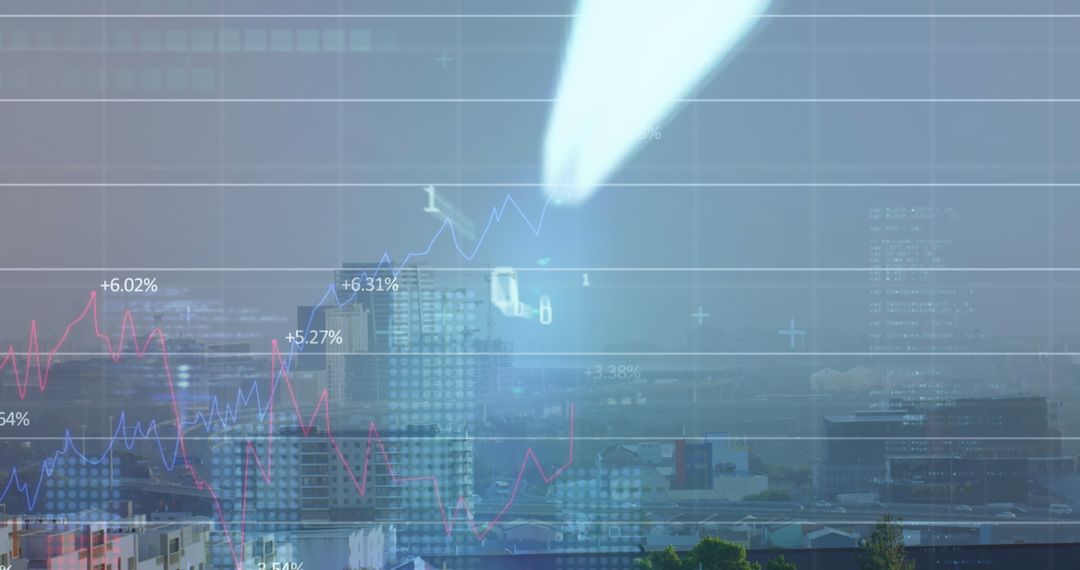
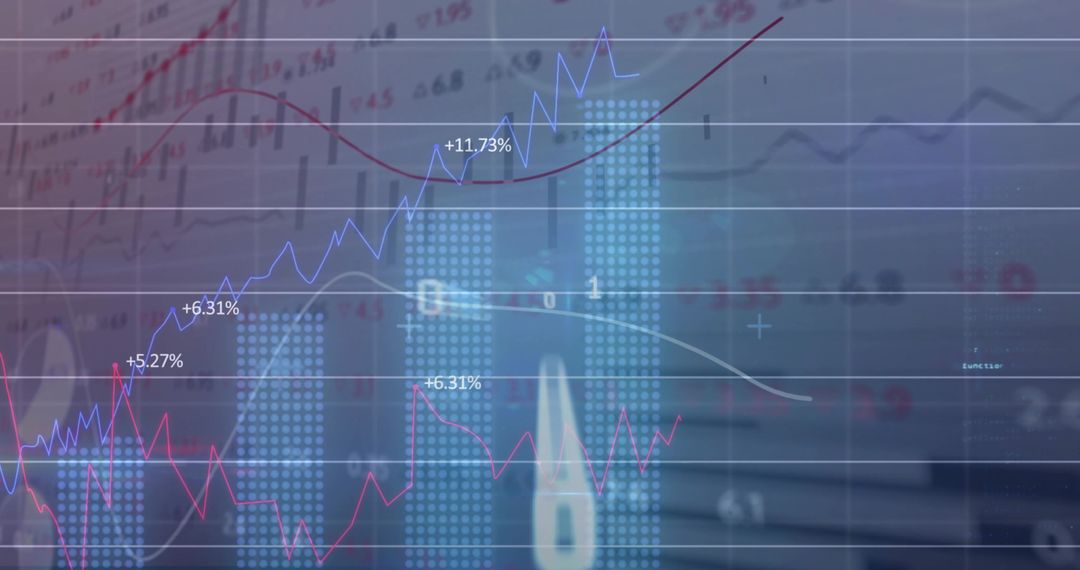
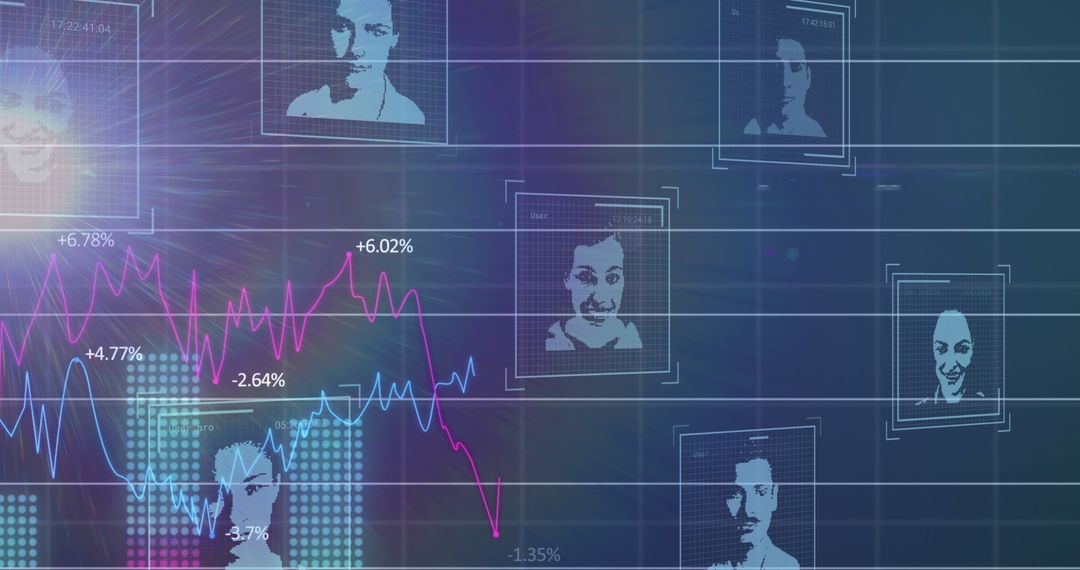
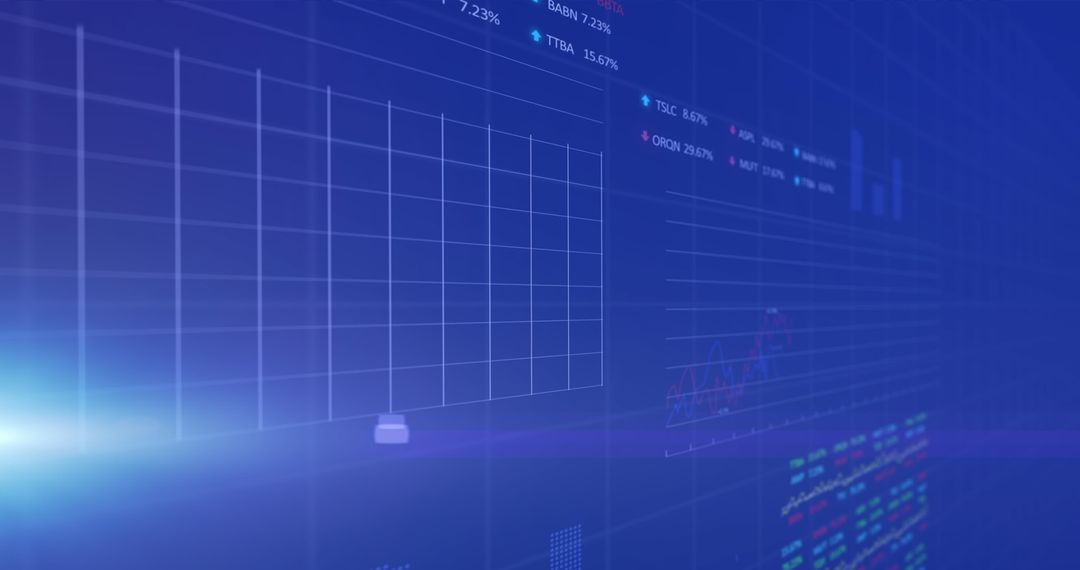
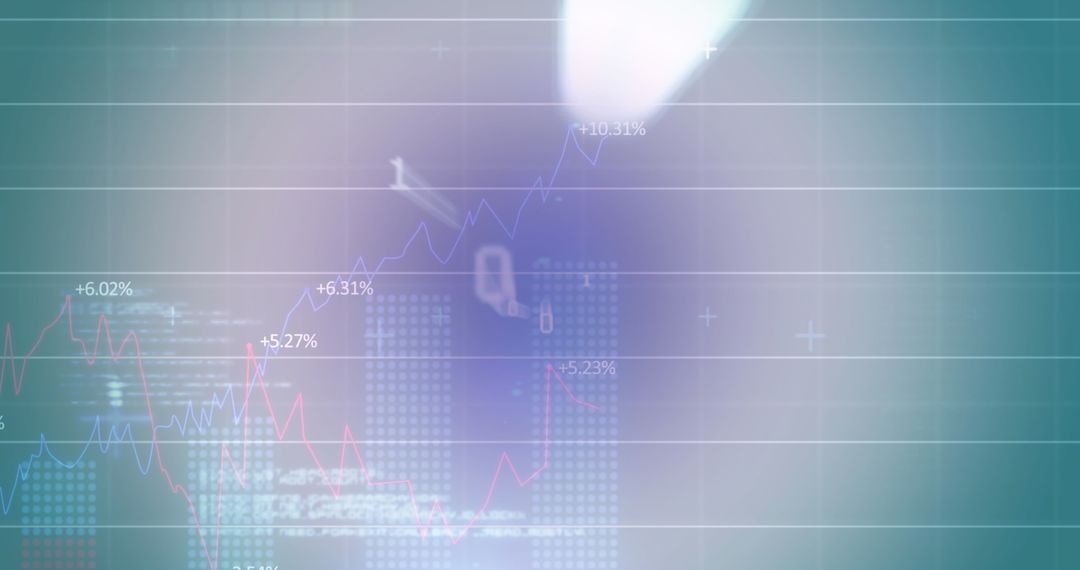
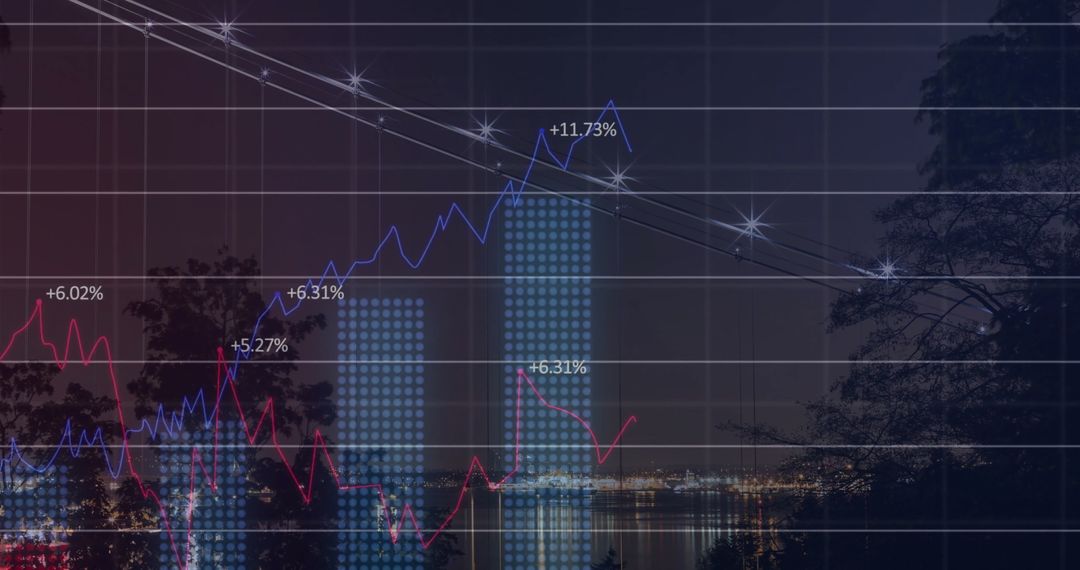
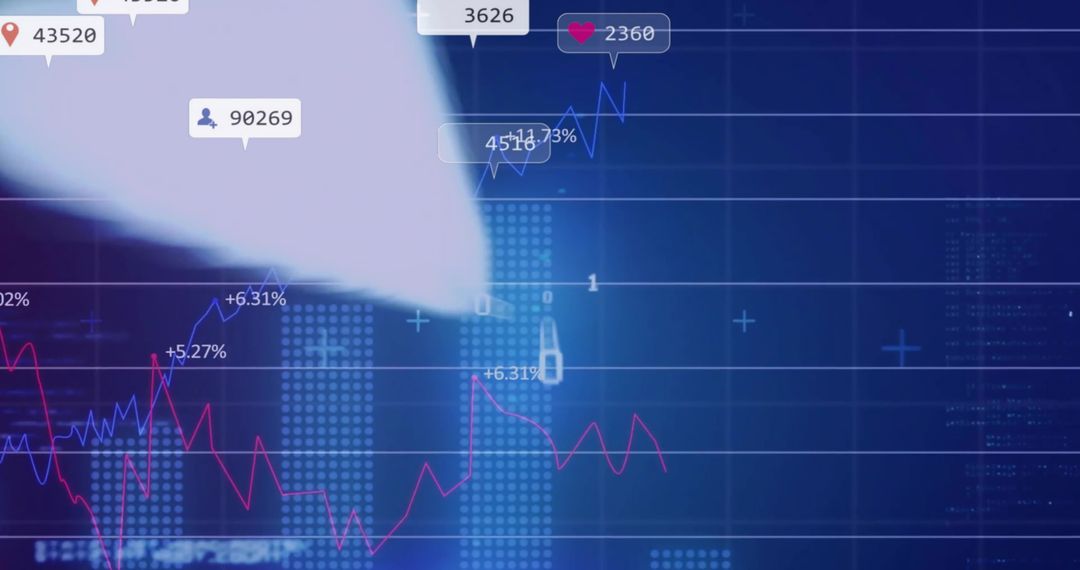
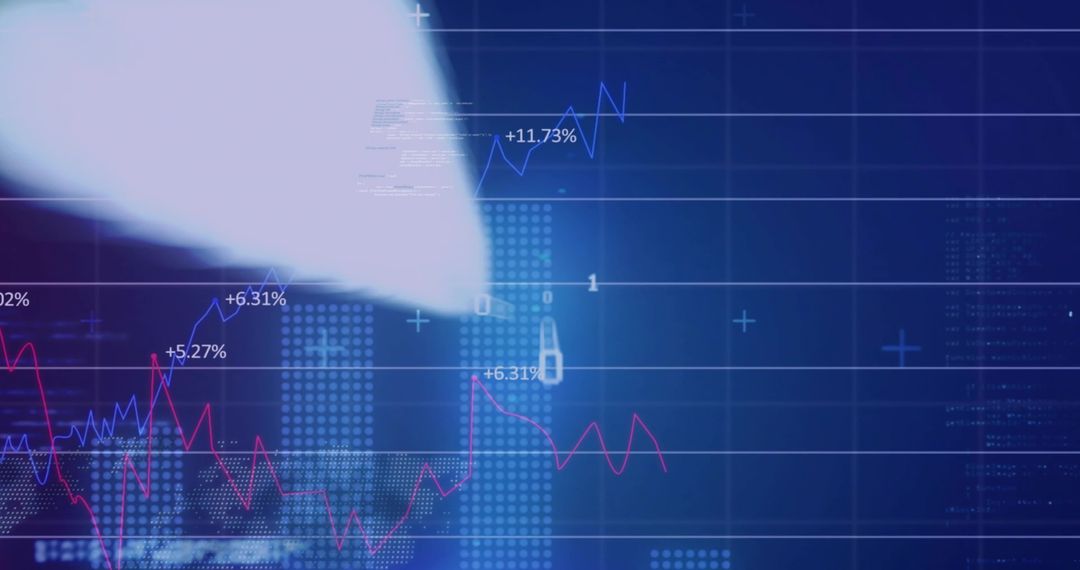
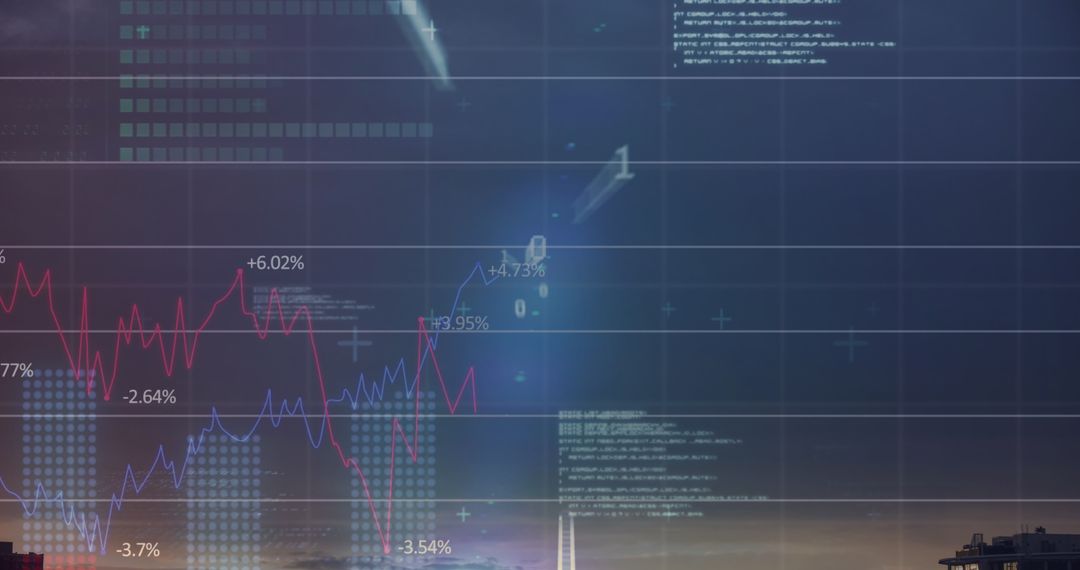
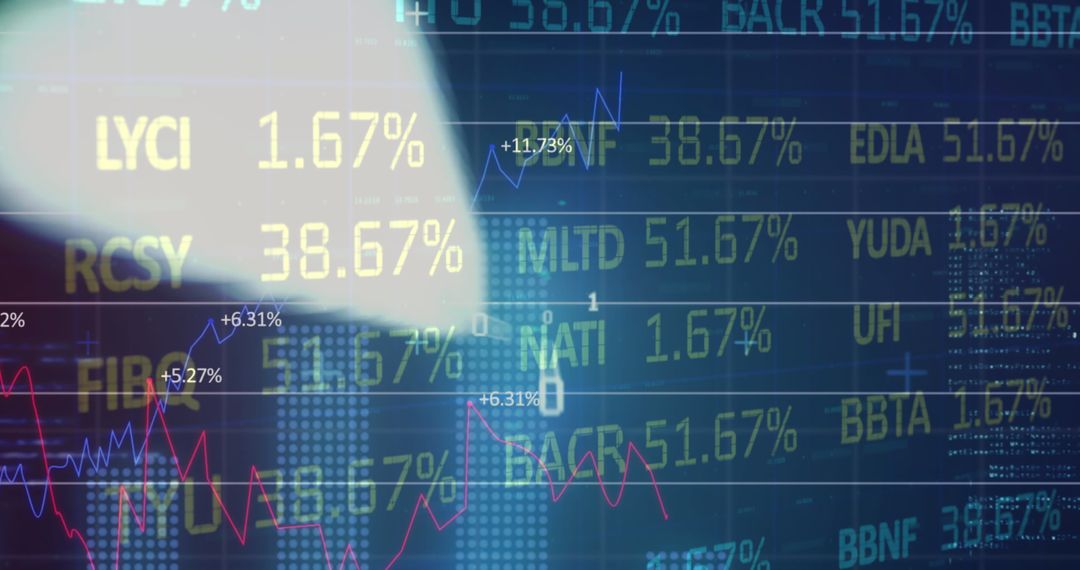
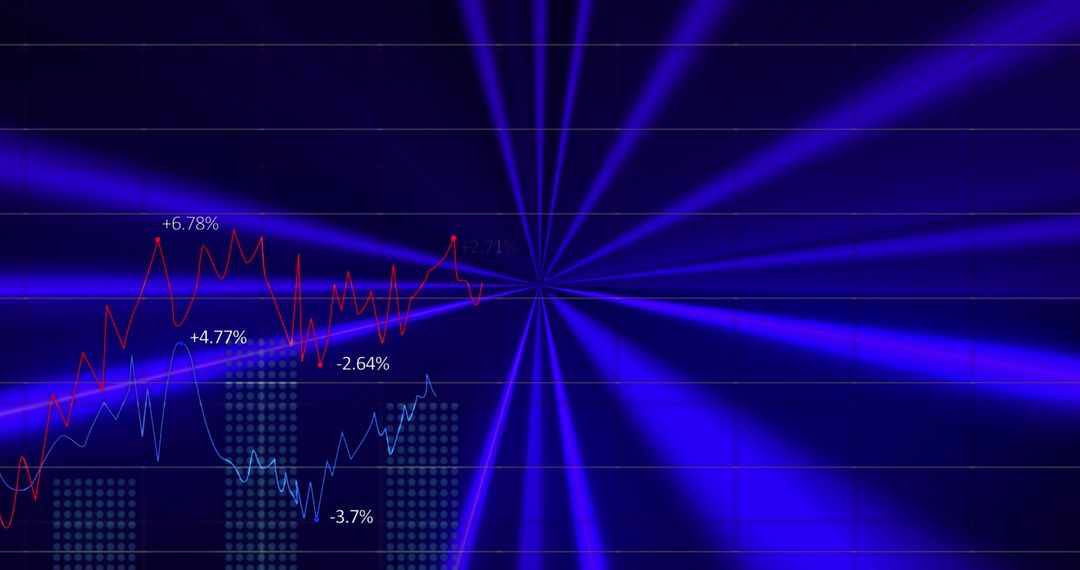
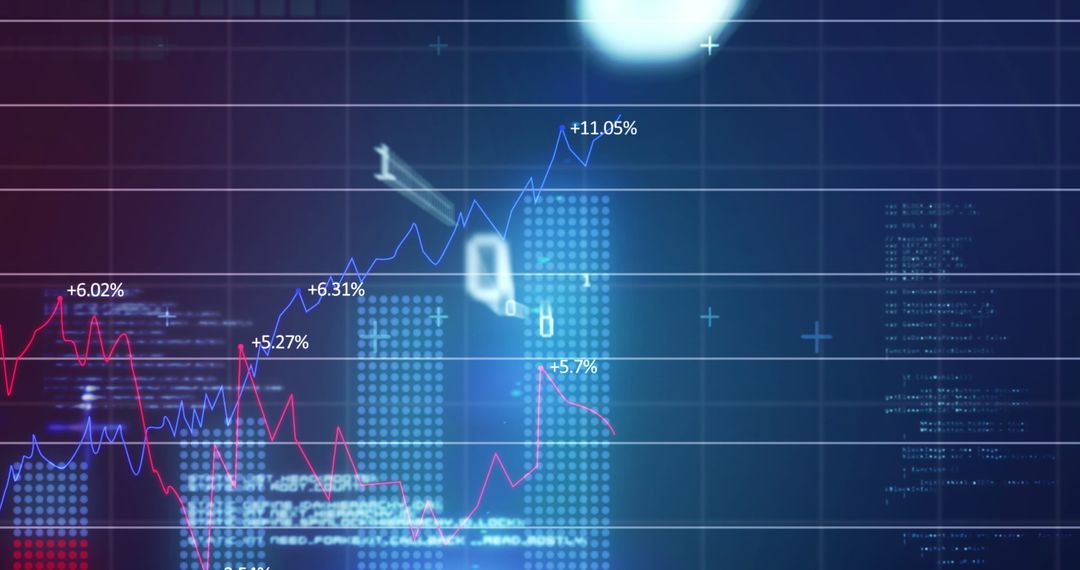
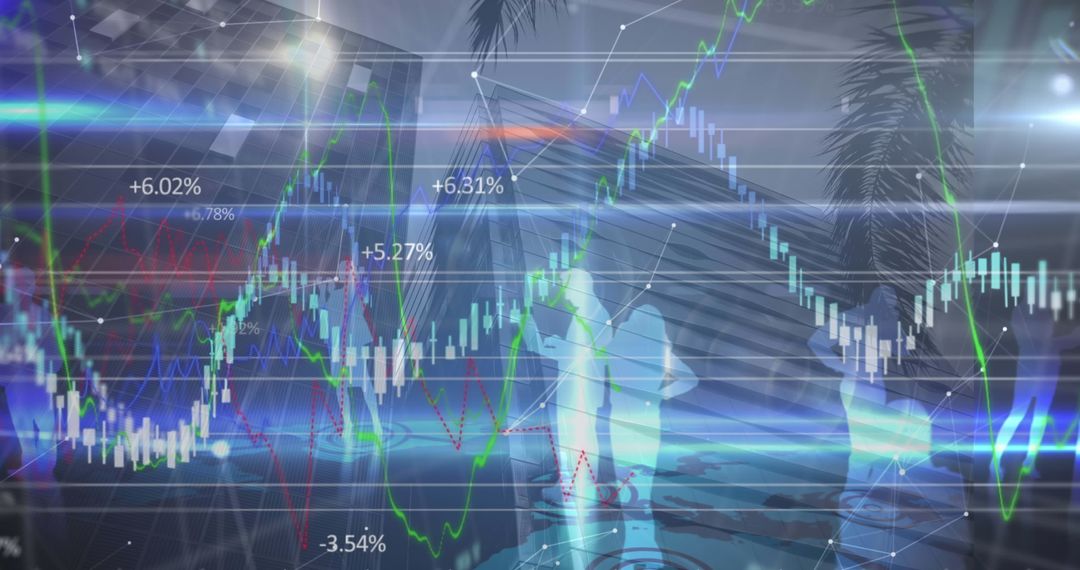
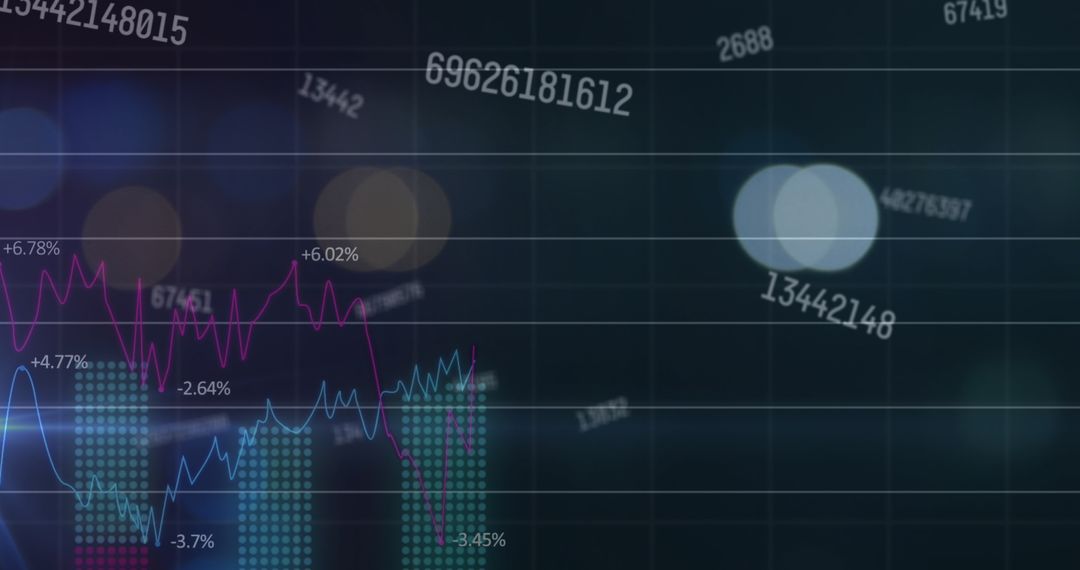
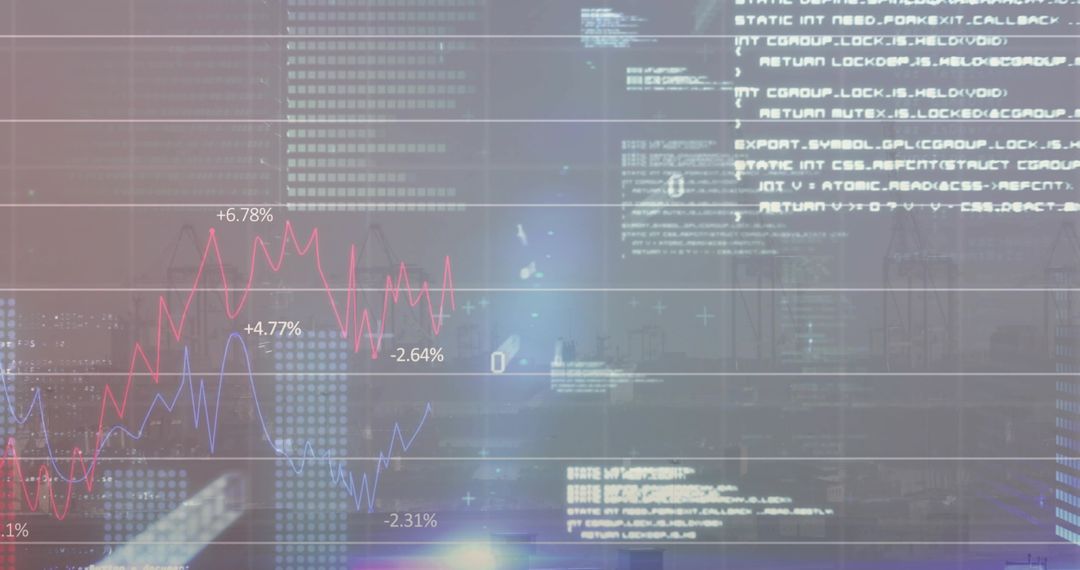
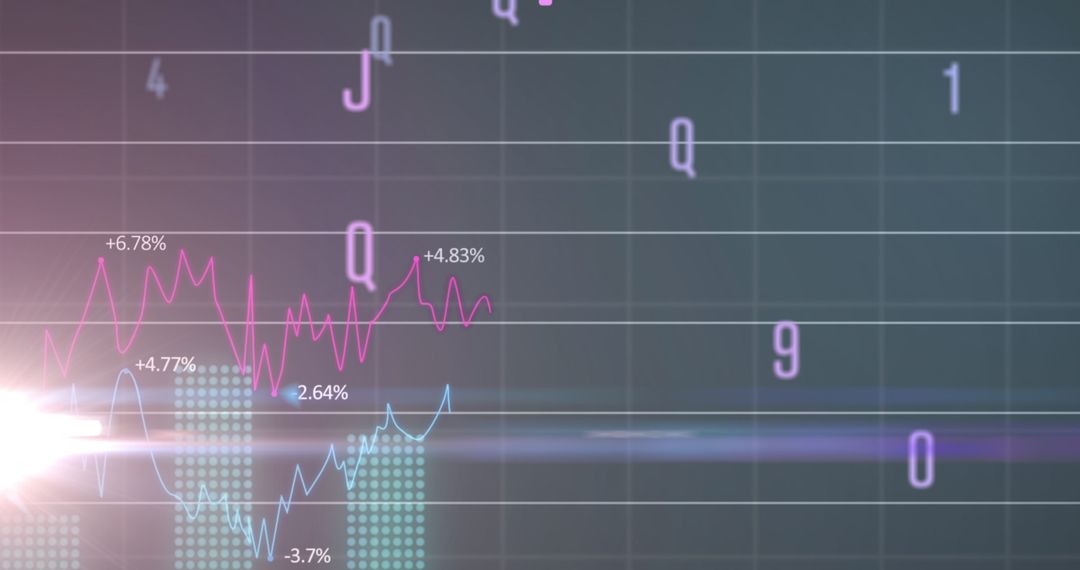
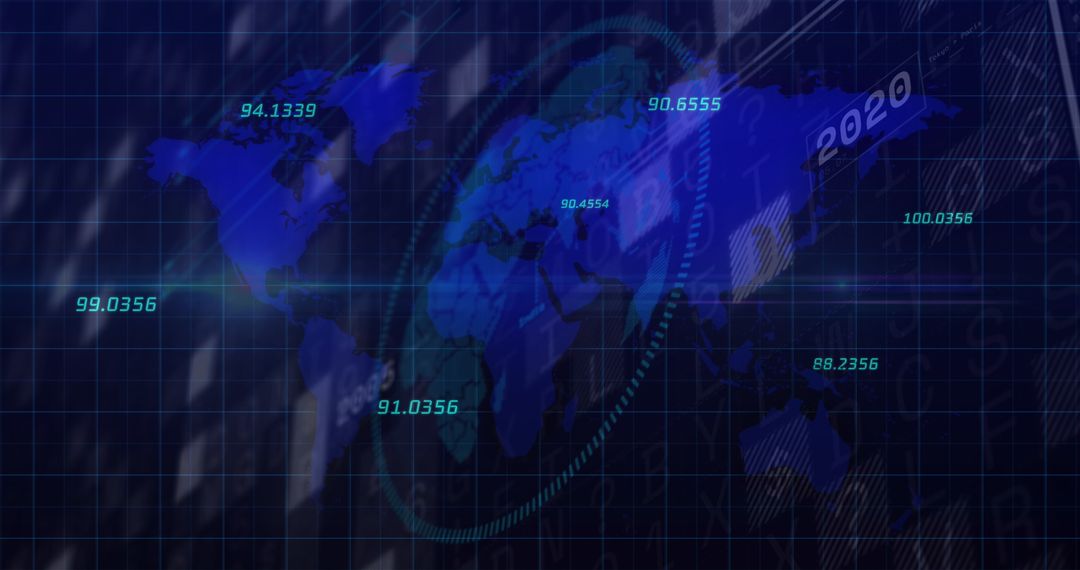
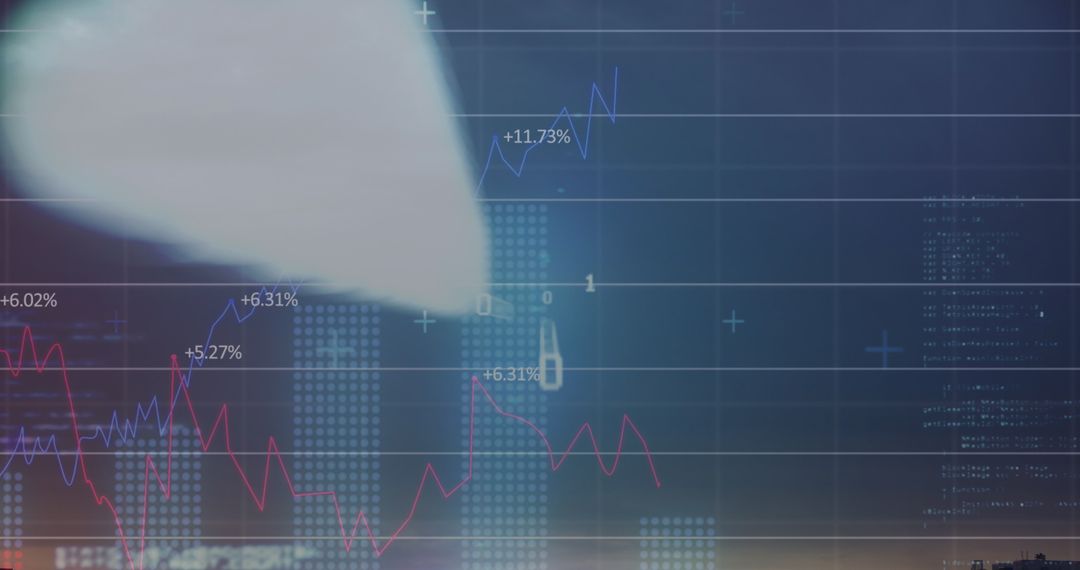
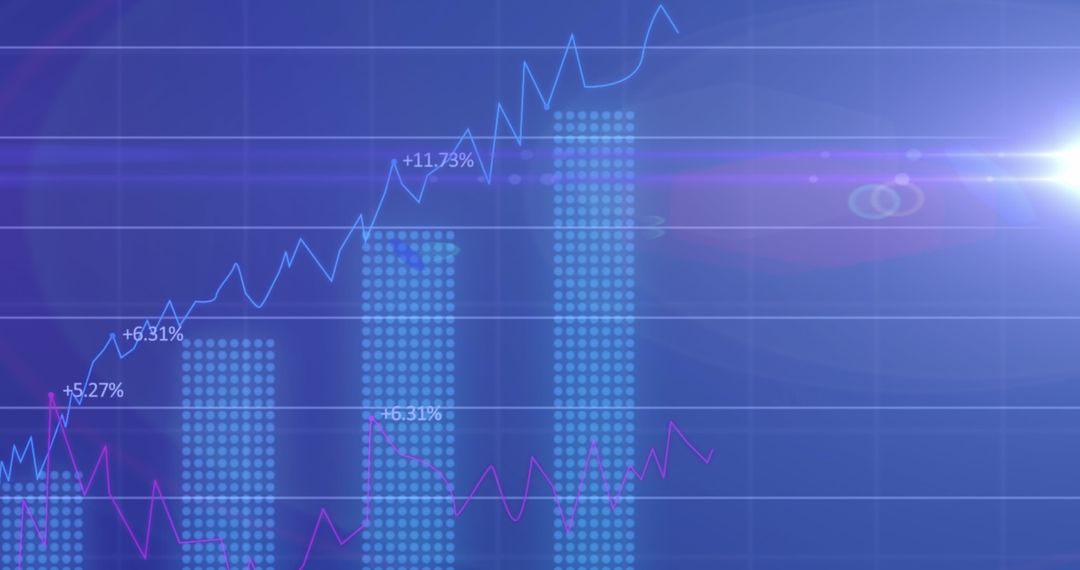
- Digital market analytics dashboard showing red and blue trend lines with percent labels
Digital market analytics dashboard showing red and blue trend lines with percent labels Image

Showing digital market analytics dashboard with red and blue trend lines overlaid on dotted bar graphs and horizontal gridlines. Featuring percent labels (+6.31%, +11.73%) and subtle code text in background for modern tech aesthetic. Offering clean horizontal composition, cool blue color palette, and strong contrast for headline or background use. Suitable for business presentations, fintech websites, investor reports, trading blogs, social media ads for financial services, and corporate pitch decks. Working well as hero banner, slide header, data visualization example, app UI mockup, or editorial illustration for articles about market performance and investment strategy.
Powered by 


0
downloads
downloads
Tags:
More
Credit Photo
If you would like to credit the Photo, here are some ways you can do so
Text Link
photo Link
<span class="text-link">
<span>
<a target="_blank" href=https://pikwizard.com/photo/digital-market-analytics-dashboard-showing-red-and-blue-trend-lines-with-percent-labels/c3530a0ecf8931e6fa5d5b9a67d4798e/>PikWizard</a>
</span>
</span>
<span class="image-link">
<span
style="margin: 0 0 20px 0; display: inline-block; vertical-align: middle; width: 100%;"
>
<a
target="_blank"
href="https://pikwizard.com/photo/digital-market-analytics-dashboard-showing-red-and-blue-trend-lines-with-percent-labels/c3530a0ecf8931e6fa5d5b9a67d4798e/"
style="text-decoration: none; font-size: 10px; margin: 0;"
>
<img src="https://pikwizard.com/pw/medium/c3530a0ecf8931e6fa5d5b9a67d4798e.jpg" style="margin: 0; width: 100%;" alt="" />
<p style="font-size: 12px; margin: 0;">PikWizard</p>
</a>
</span>
</span>
Free (free of charge)
Free for personal and commercial use.
Author: People Creations
Similar Free Stock Images

Premium


Premium


Premium


Premium


Premium


Premium


Premium


Premium


Premium


Premium


Premium


Premium


Premium

Premium


Premium


Premium


Premium


Premium


Premium


Premium


Premium


Premium


Premium


Premium