
- Home >
- Stock Photos >
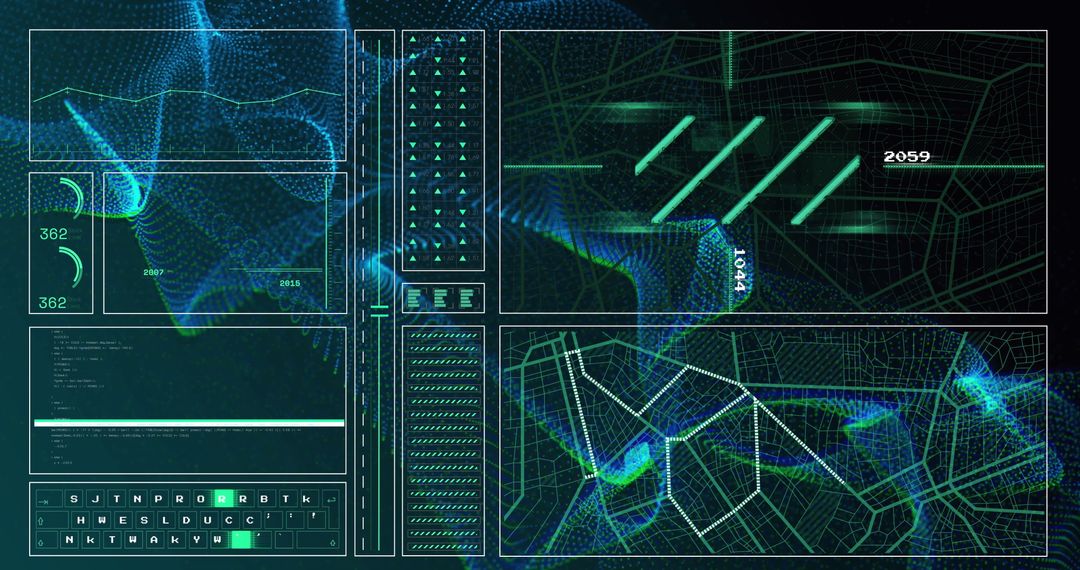
- Displaying Futuristic Data Dashboard with Neon Line Charts, Metric Panels and Gauge UI
Displaying Futuristic Data Dashboard with Neon Line Charts, Metric Panels and Gauge UI Image

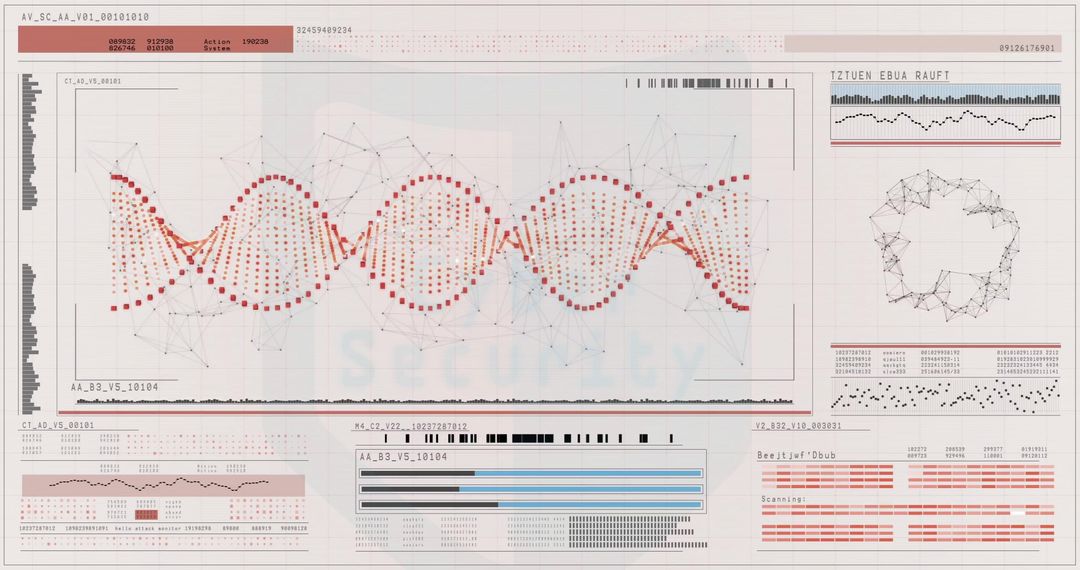
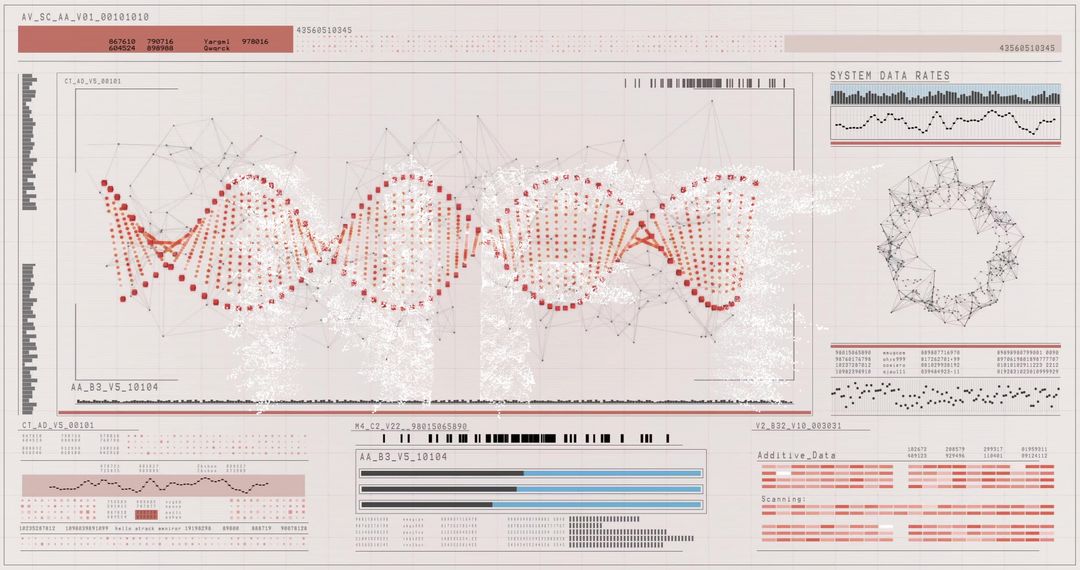
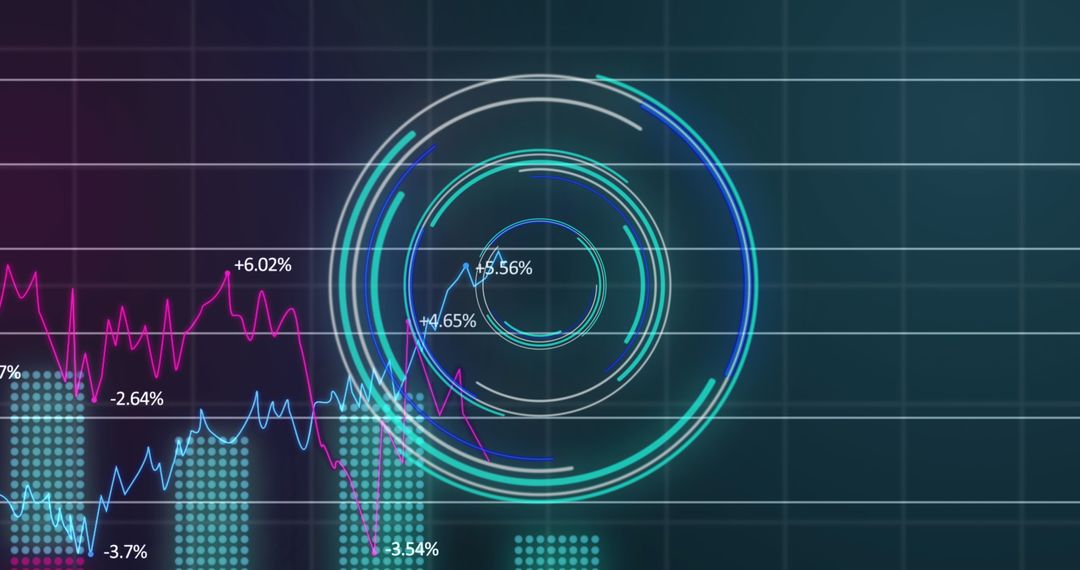
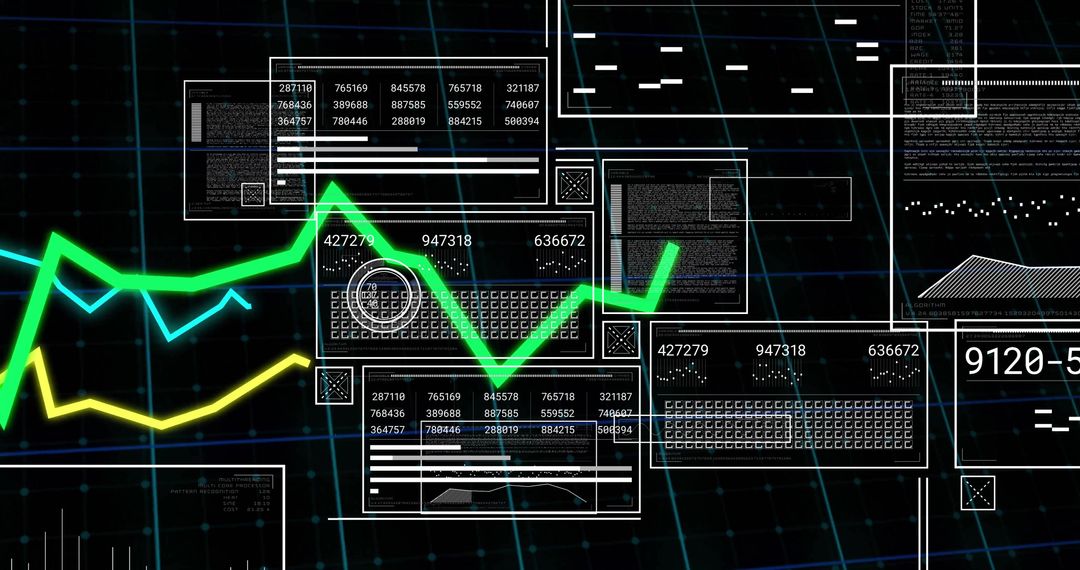
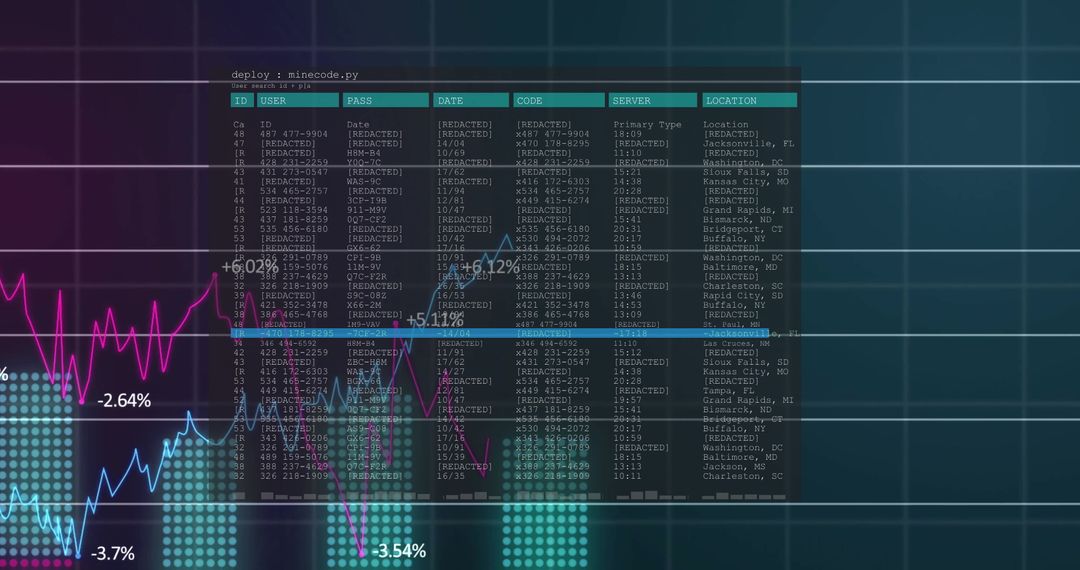
Presenting dark futuristic dashboard featuring neon teal and red line charts, numeric tables, circular gauge reading 2474, grid overlay and glowing UI panels. Composing high-tech aesthetic for fintech, data science, cybersecurity and IoT projects. Working well as hero background for website headers, app mockups, pitch decks, investor reports and technology blog banners. Serving as visual asset for presentation slides, social media posts, advertising, editorial features and broadcast graphics. Allowing color overlay and text placement for branding, headlines or product messaging.
Powered by  - Get 15% off with code: PIKWIZARD15


0
downloads
downloads
Tags:
More
Credit Photo
If you would like to credit the Photo, here are some ways you can do so
Text Link
photo Link
<span class="text-link">
<span>
<a target="_blank" href=https://pikwizard.com/photo/displaying-futuristic-data-dashboard-with-neon-line-charts-metric-panels-and-gauge-ui/36263356ed51ccdd15d3bde4c2fd669c/>PikWizard</a>
</span>
</span>
<span class="image-link">
<span
style="margin: 0 0 20px 0; display: inline-block; vertical-align: middle; width: 100%;"
>
<a
target="_blank"
href="https://pikwizard.com/photo/displaying-futuristic-data-dashboard-with-neon-line-charts-metric-panels-and-gauge-ui/36263356ed51ccdd15d3bde4c2fd669c/"
style="text-decoration: none; font-size: 10px; margin: 0;"
>
<img src="https://pikwizard.com/pw/medium/36263356ed51ccdd15d3bde4c2fd669c.jpg" style="margin: 0; width: 100%;" alt="" />
<p style="font-size: 12px; margin: 0;">PikWizard</p>
</a>
</span>
</span>
Free (free of charge)
Free for personal and commercial use.
Author: Authentic Images
Similar Free Stock Images

Premium


Premium


Premium


Premium


Premium


Premium


Premium


Premium


Premium


Premium


Premium


Premium


Premium


Premium


Premium


Premium


Premium


Premium


Premium


Premium


Premium


Premium


Premium


Premium

