- Home >
- Stock Photos >
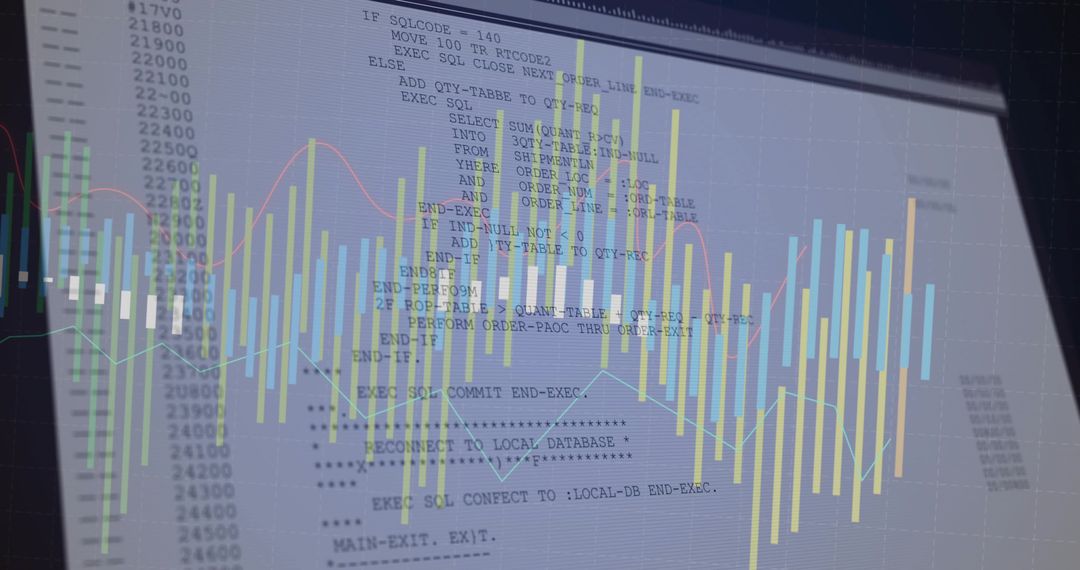
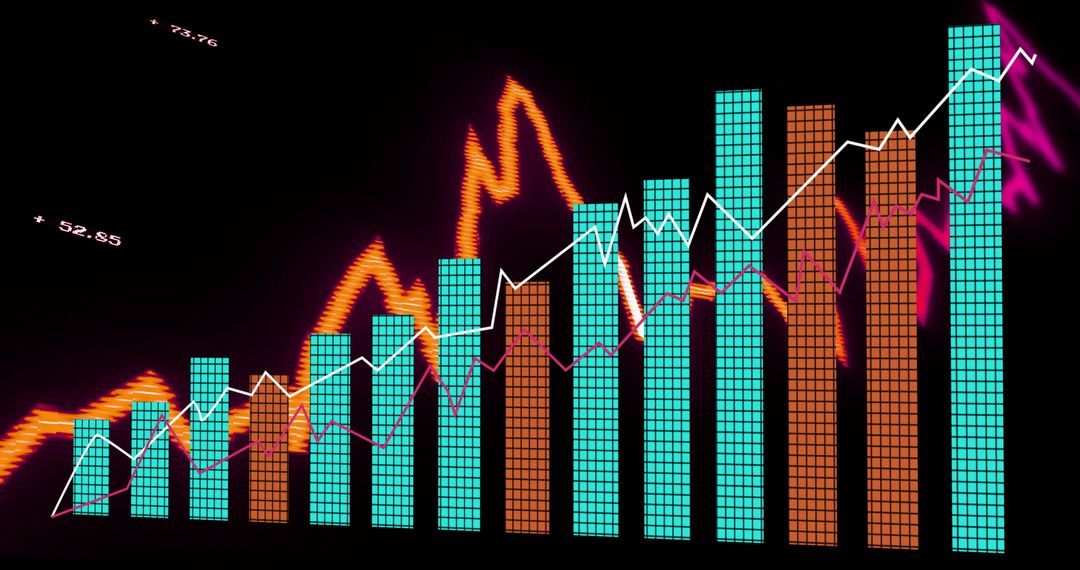
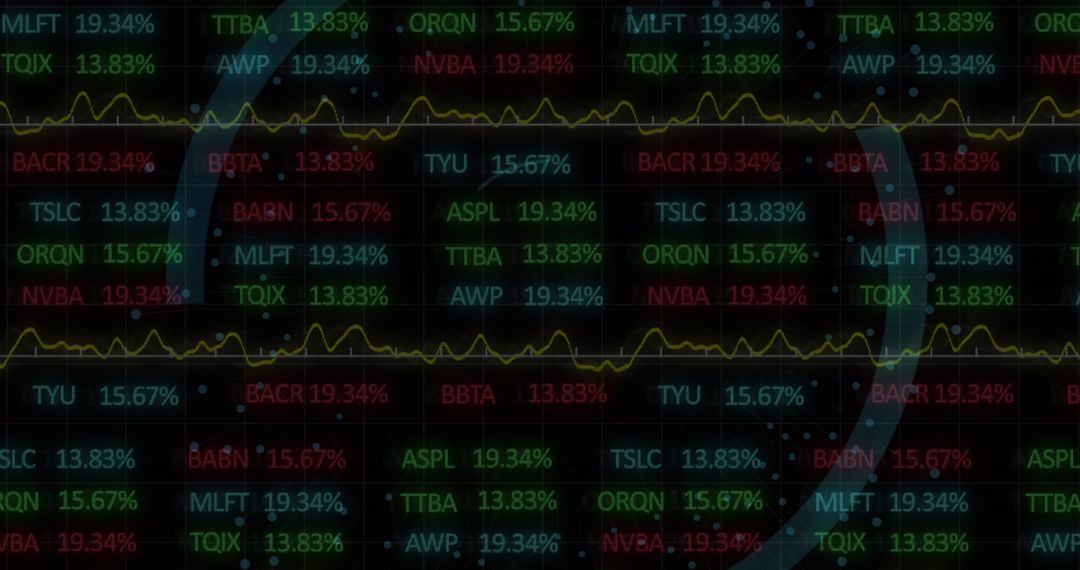
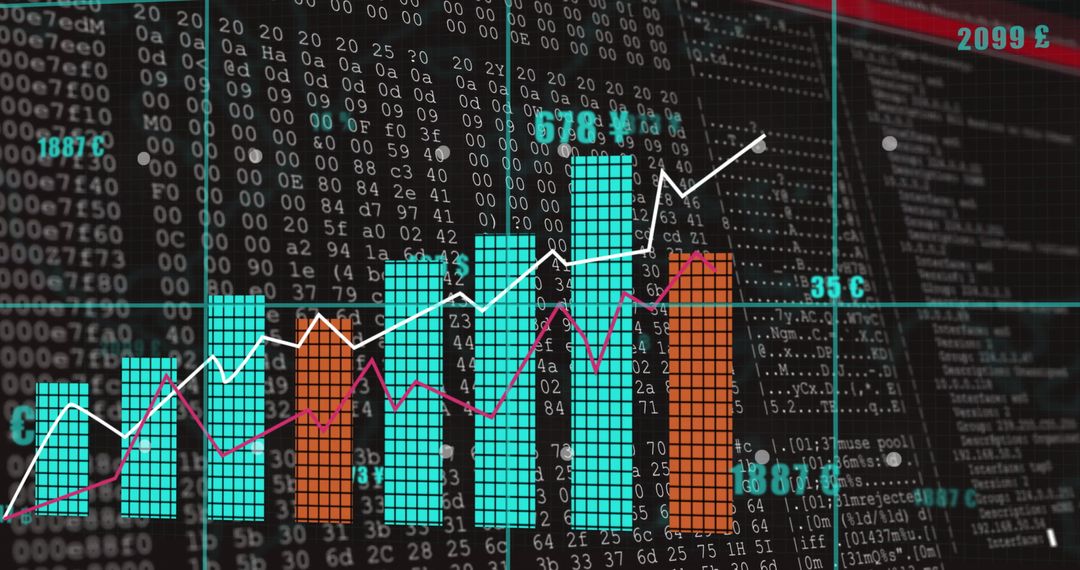
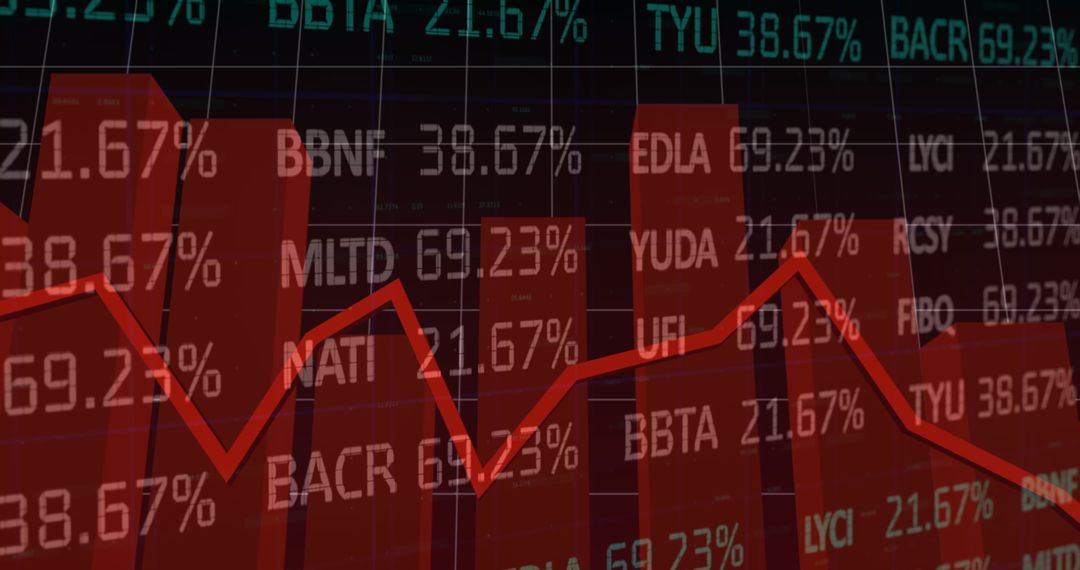
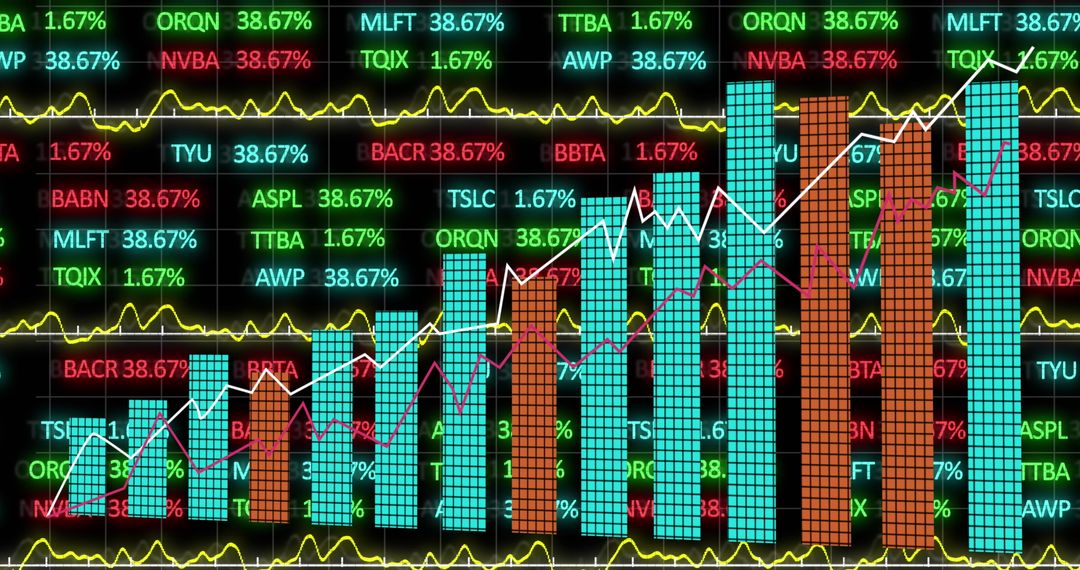
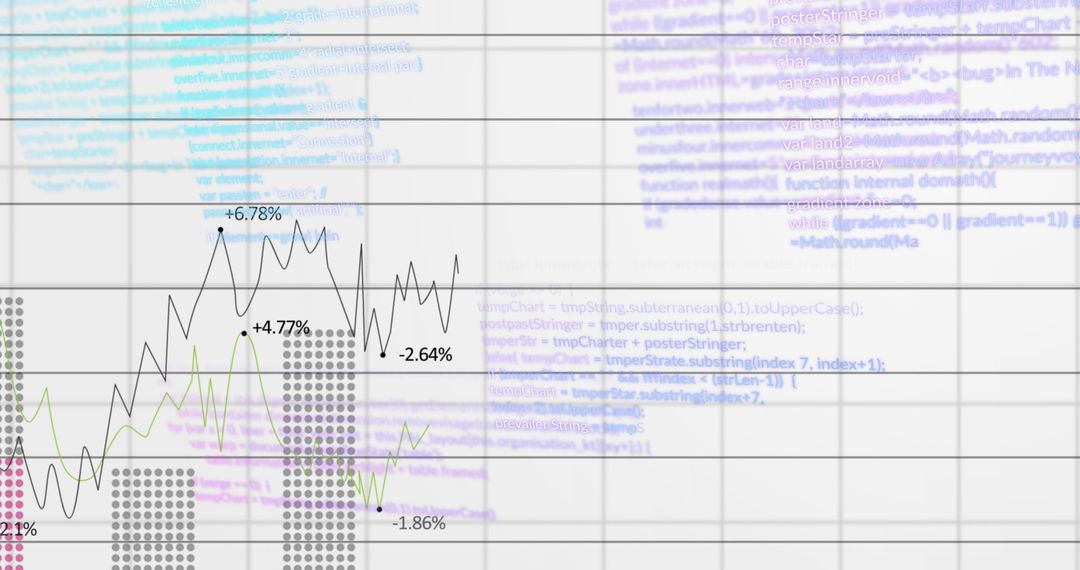
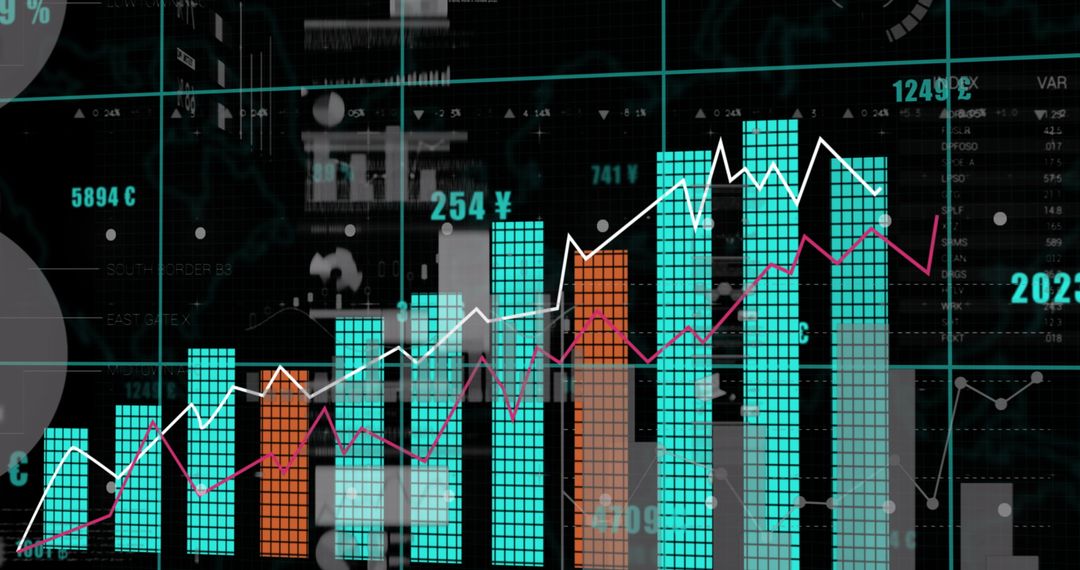
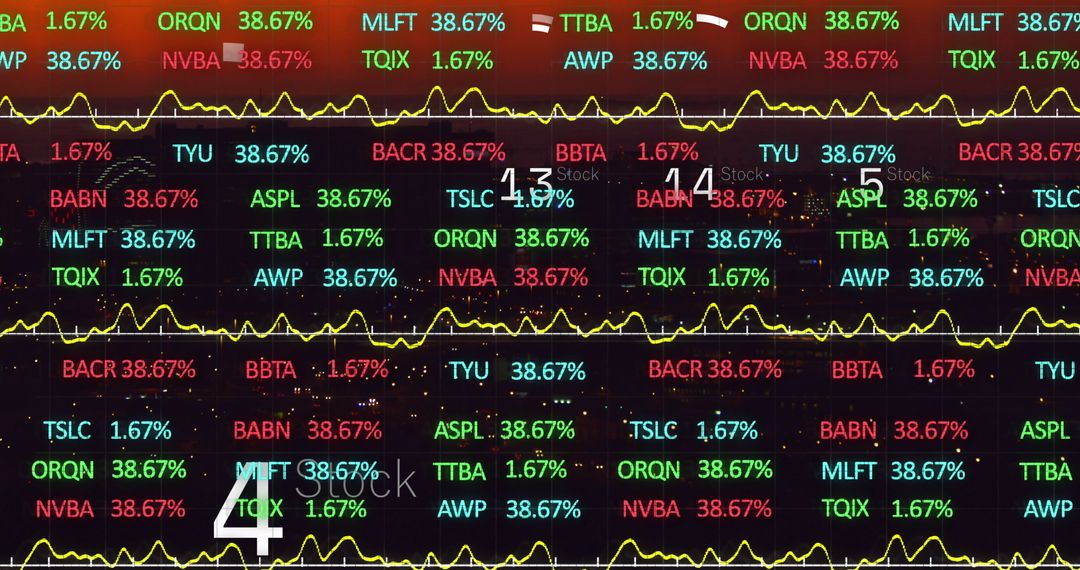
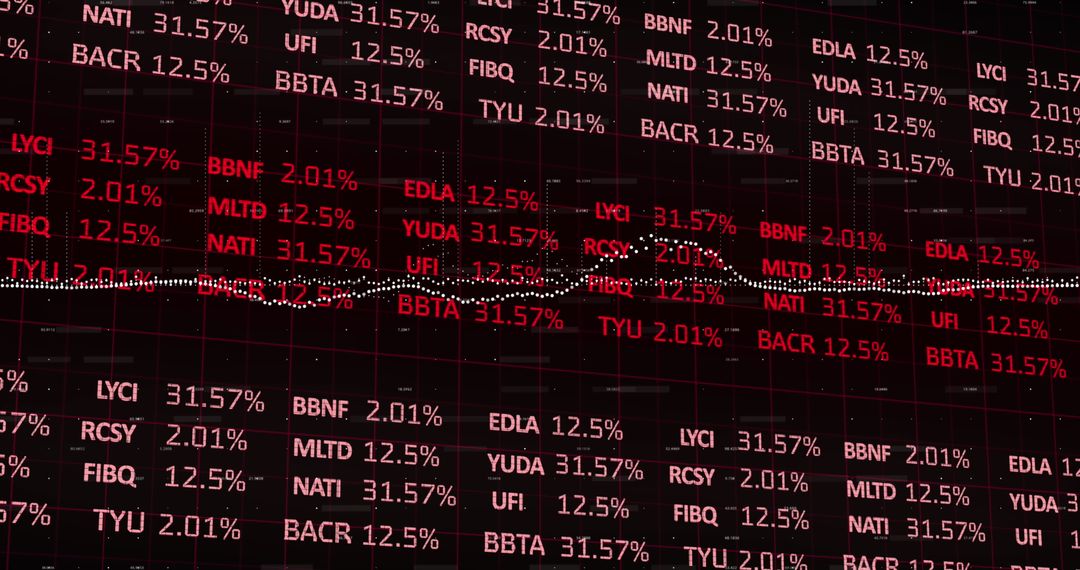
- Dynamic Bar and Line Chart Representing Market Trends on Digital Screen
Dynamic Bar and Line Chart Representing Market Trends on Digital Screen Image

Complex pattern shows bar chart in teal and orange alongside white and magenta lines on grid screen with blue marker accent highlighting segments indicating key moments. Useful for illustrating sophisticated data visualization, market analytics focused products, financial reports, blog posts about investment techniques, and presentations.
Powered by  - Get 15% off with code: PIKWIZARD15


0
downloads
downloads
Tags:
More
Credit Photo
If you would like to credit the Photo, here are some ways you can do so
Text Link
photo Link
<span class="text-link">
<span>
<a target="_blank" href=https://pikwizard.com/photo/dynamic-bar-and-line-chart-representing-market-trends-on-digital-screen/efa66d5f3ca344742469fdd2b8175aec/>PikWizard</a>
</span>
</span>
<span class="image-link">
<span
style="margin: 0 0 20px 0; display: inline-block; vertical-align: middle; width: 100%;"
>
<a
target="_blank"
href="https://pikwizard.com/photo/dynamic-bar-and-line-chart-representing-market-trends-on-digital-screen/efa66d5f3ca344742469fdd2b8175aec/"
style="text-decoration: none; font-size: 10px; margin: 0;"
>
<img src="https://pikwizard.com/pw/medium/efa66d5f3ca344742469fdd2b8175aec.jpg" style="margin: 0; width: 100%;" alt="" />
<p style="font-size: 12px; margin: 0;">PikWizard</p>
</a>
</span>
</span>
Free (free of charge)
Free for personal and commercial use.
Author: Creative Art
Similar Free Stock Images

Premium


Premium


Premium


Premium


Premium


Premium


Premium


Premium


Premium


Premium


Premium


Premium


Premium


Premium


Premium


Premium


Premium


Premium


Premium


Premium


Premium


Premium


Premium


Premium