- Home >
- Stock Photos >
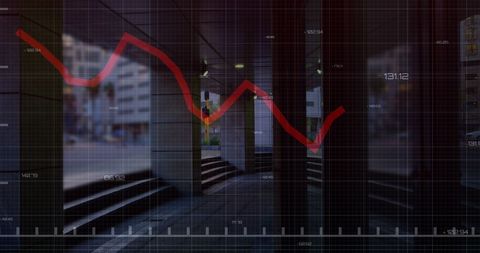
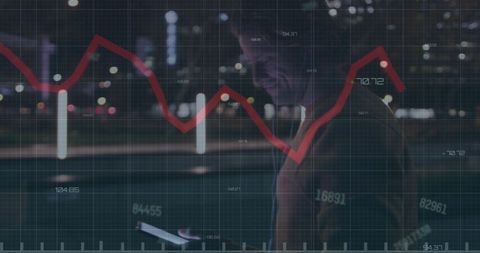
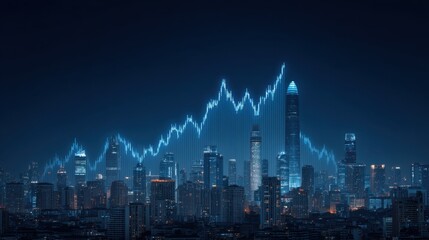
- Financial Data Overlaid on Night Cityscape with Red Trend Line
Financial Data Overlaid on Night Cityscape with Red Trend Line Image

Surrounded by the glow of city lights, the scene shows an imposing financial graph highlighted with a bold red trend line. The underlying cityscape gives dimension, suggesting themes of global finance and economy. Useful for illustrating articles or reports relating to financial trends, economic forecasts, or the integration of technology and urban development.
Powered by 


downloads
Tags:
More
Credit Photo
If you would like to credit the Photo, here are some ways you can do so
Text Link
photo Link
<span class="text-link">
<span>
<a target="_blank" href=https://pikwizard.com/photo/financial-data-overlaid-on-night-cityscape-with-red-trend-line/2267e861311a7e332f11d54d1418d07a/>PikWizard</a>
</span>
</span>
<span class="image-link">
<span
style="margin: 0 0 20px 0; display: inline-block; vertical-align: middle; width: 100%;"
>
<a
target="_blank"
href="https://pikwizard.com/photo/financial-data-overlaid-on-night-cityscape-with-red-trend-line/2267e861311a7e332f11d54d1418d07a/"
style="text-decoration: none; font-size: 10px; margin: 0;"
>
<img src="https://pikwizard.com/pw/medium/2267e861311a7e332f11d54d1418d07a.jpg" style="margin: 0; width: 100%;" alt="" />
<p style="font-size: 12px; margin: 0;">PikWizard</p>
</a>
</span>
</span>
Free (free of charge)
Free for personal and commercial use.
Author: Awesome Content
Similar Free Stock Images
Loading...

Premium


Premium


Premium

Premium


Premium


Premium


Premium


Premium


Premium


Premium


Premium


Premium


Premium

Premium


Premium


Premium


Premium


Premium


Premium


Premium


Premium


Premium

Premium


Premium


Premium