- Home >
- Stock Photos >
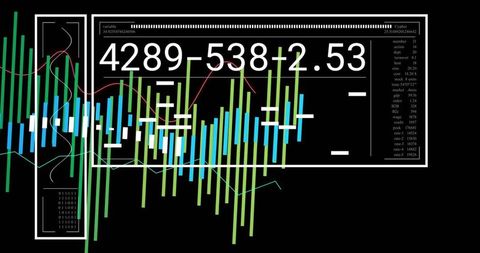
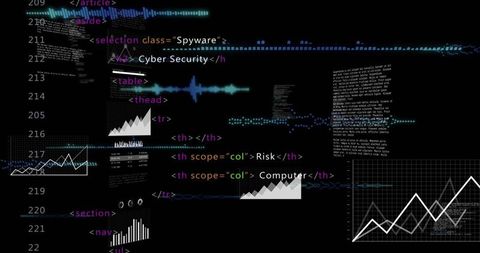
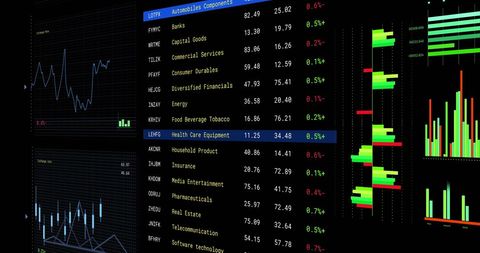
- Financial Data Processing with Digital Interface Graphics
Financial Data Processing with Digital Interface Graphics Image

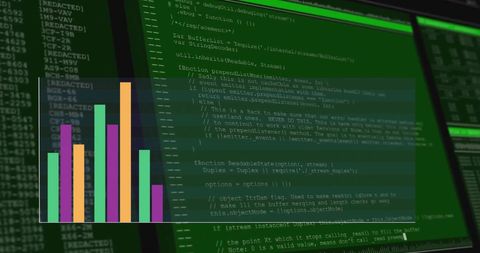
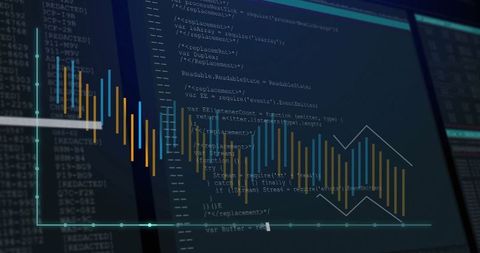
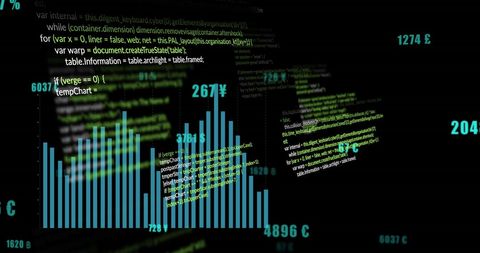
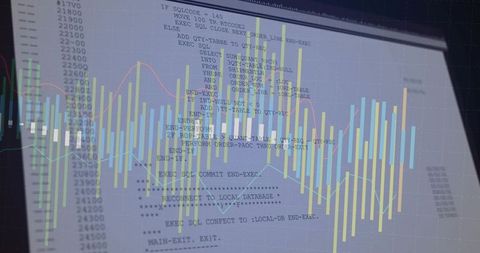
This visual depicts the intersection of financial data with digital technology, showcasing integral components such as programming code and graphical data representations. Ideal for illustrating articles on financial technology or fintech advancements, this design also effectively conveys themes of economic analysis, data processing innovation, and the dynamics of modern business.

downloads
Tags:
More
Credit Photo
If you would like to credit the Photo, here are some ways you can do so
Text Link
photo Link
<span class="text-link">
<span>
<a target="_blank" href=https://pikwizard.com/photo/financial-data-processing-with-digital-interface-graphics/406fdd76aa6d7fffc8eb021c5b590541/>PikWizard</a>
</span>
</span>
<span class="image-link">
<span
style="margin: 0 0 20px 0; display: inline-block; vertical-align: middle; width: 100%;"
>
<a
target="_blank"
href="https://pikwizard.com/photo/financial-data-processing-with-digital-interface-graphics/406fdd76aa6d7fffc8eb021c5b590541/"
style="text-decoration: none; font-size: 10px; margin: 0;"
>
<img src="https://pikwizard.com/pw/medium/406fdd76aa6d7fffc8eb021c5b590541.jpg" style="margin: 0; width: 100%;" alt="" />
<p style="font-size: 12px; margin: 0;">PikWizard</p>
</a>
</span>
</span>
Free (free of charge)
Free for personal and commercial use.
Author: Awesome Content