
- Home >
- Stock Photos >
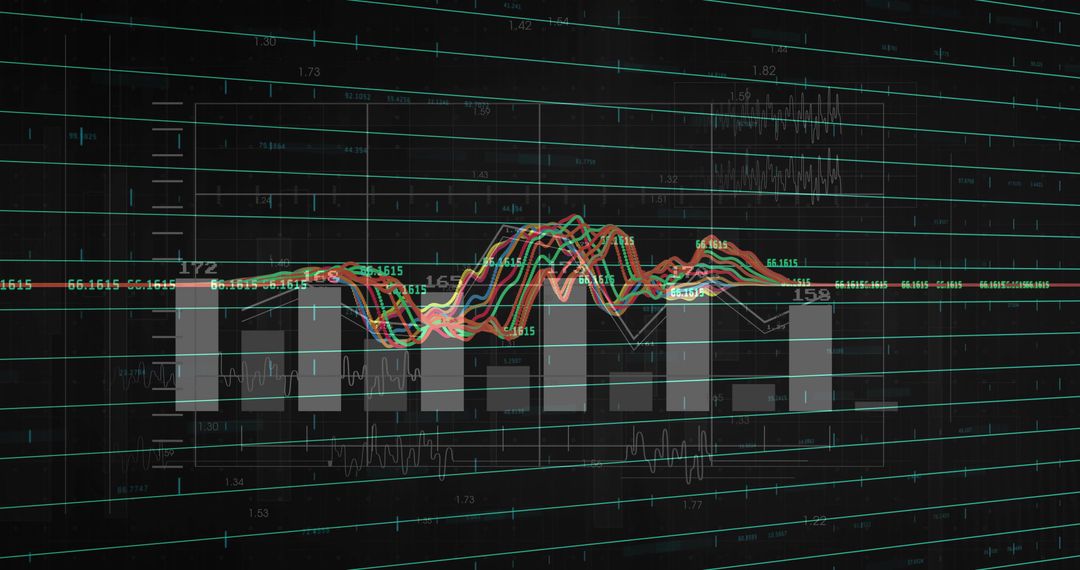
- Financial Data Visualization with Charts and Graphs Showing Market Trends
Financial Data Visualization with Charts and Graphs Showing Market Trends Image
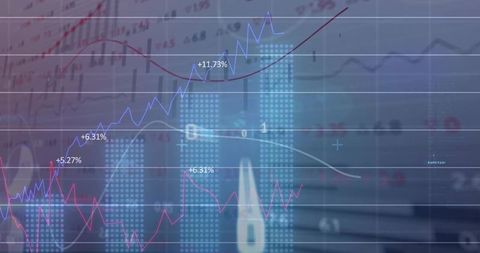
Digital dashboard presenting complex financial data with bar and line graphs conveying market trends and analytics insights. Ideal for use in presentations on economic analysis, financial reporting, business reviews or to add a professional touch to content discussing data-driven decision-making.
Powered by  - Get 15% off with code: PIKWIZARD15


0
downloads
downloads
Tags:
More
Credit Photo
If you would like to credit the Photo, here are some ways you can do so
Text Link
photo Link
<span class="text-link">
<span>
<a target="_blank" href=https://pikwizard.com/photo/financial-data-visualization-with-charts-and-graphs-showing-market-trends/a82393b1c0c9c7a818e86165327975b4/>PikWizard</a>
</span>
</span>
<span class="image-link">
<span
style="margin: 0 0 20px 0; display: inline-block; vertical-align: middle; width: 100%;"
>
<a
target="_blank"
href="https://pikwizard.com/photo/financial-data-visualization-with-charts-and-graphs-showing-market-trends/a82393b1c0c9c7a818e86165327975b4/"
style="text-decoration: none; font-size: 10px; margin: 0;"
>
<img src="https://pikwizard.com/pw/medium/a82393b1c0c9c7a818e86165327975b4.jpg" style="margin: 0; width: 100%;" alt="" />
<p style="font-size: 12px; margin: 0;">PikWizard</p>
</a>
</span>
</span>
Free (free of charge)
Free for personal and commercial use.
Author: Authentic Images
Similar Free Stock Images

Premium


Premium


Premium


Premium


Premium


Premium


Premium


Premium


Premium


Premium


Premium


Premium


Premium


Premium


Premium


Premium


Premium


Premium


Premium


Premium


Premium


Premium


Premium


Premium

